new blog post: Member Training: The Dark Side of Data Science

Previous Posts
In this 10-part tutorial, you will learn how to get started using SPSS for data preparation, analysis, and graphing. This tutorial will give you the skills to start using SPSS on your own. You will need a license to SPSS and to have it installed before you begin.
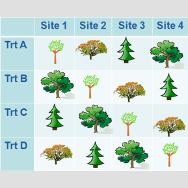
If you analyze non-experimental data, is it helpful to understand experimental design principles? Yes, absolutely! Understanding experimental design can help you recognize the questions you can and can’t answer with the data. It will also help you identify possible sources of bias that can lead to undesirable results. Finally, it will help you provide recommendations […]
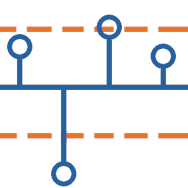
Analysis of Means (ANOM) is an underappreciated methodology that has relevance to quality control and institutional comparisons.
There is a lot of skill needed to perform good data analyses. It is not just about statistical knowledge (though more statistical knowledge is always helpful). Organizing your data analysis, and knowing how to do that, is a key skill.
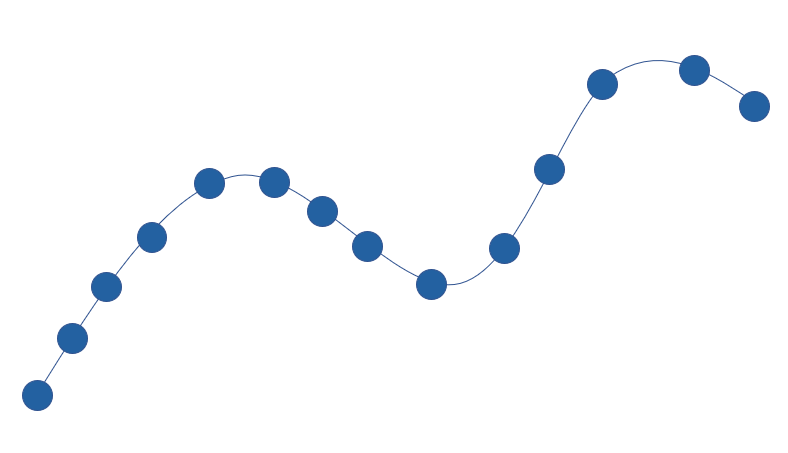
Interrupted time series analysis is a useful and specialized tool for understanding the impact of a change in circumstances on a long-term trend. The data for interrupted time series is a specific type of longitudinal data and must meet two criteria.
It’s easy to develop bad habits in data analysis. It's very complicated and you're under pressure to do a lot quickly. But shortcuts in the moment inevitably lead to problems later on. Avoid these bad habits and your future self will thank you.
Multicollinearity is simply redundancy in the information contained in predictor variables. If the redundancy is moderate, it usually only affects the interpretation of regression coefficients. But if it is severe-at or near perfect redundancy, it causes the model to "blow up." (And yes, that's a technical term). But the reality is that there are only five situations where it commonly occurs. And three of them have very simple solutions.
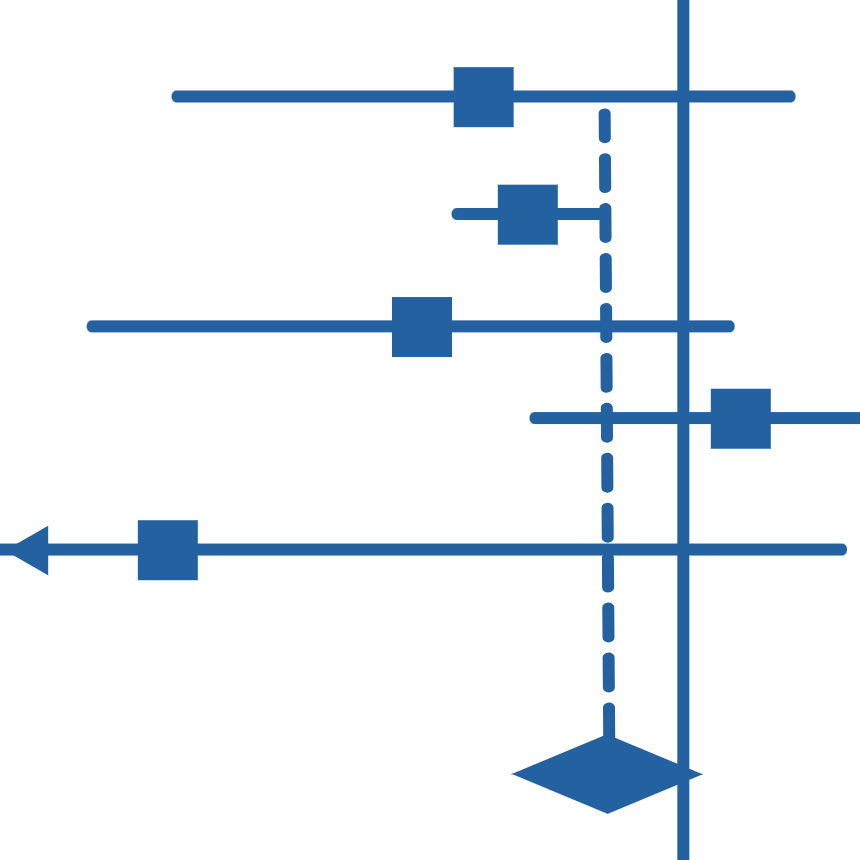
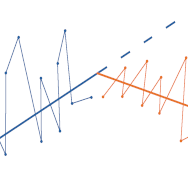
Meta-analysis allows us to synthesize the results of separate studies. The goal is to assess the mean effect size and also heterogeneity – how much the effect size varies across studies.
One of the difficult decisions in mixed modeling is deciding which factors are fixed and which are random. And as difficult as it is, it’s also very important. Correctly specifying the fixed and random factors of the model is vital to obtain accurate analyses. Now, you may be thinking of the fixed and random effects […]
In this nearly 6-hour tutorial you will learn menu-based R libraries so you can use R without having to fuss with R code. These libraries don’t cover everything R can do, but they do quite a bit and can set you up to make running R much easier.
 stat skill-building compass