new blog post: Member Training: The Dark Side of Data Science

Previous Posts
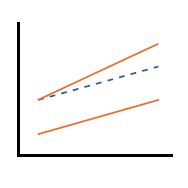
Updated 12/20/2021 Despite its popularity, interpreting regression coefficients of any but the simplest models is sometimes, well….difficult. So let’s interpret the coefficients in a model with two predictors: a continuous and a categorical variable. The example here is a linear regression model. But this works the same way for interpreting coefficients from any regression model […]
Odds ratios have a unique part to play in describing the effects of logistic regression models. But that doesn’t mean they’re easy to communicate to an audience who is likely to misinterpret them. So writing up your odds ratios has to be done with care.
The great majority of all regression modeling explores and tests the association between independent and dependent variables. We are not able to claim the independent variable(s) has a causal relationship with the dependent variable. There are five specific model types that allow us to test for causality. Difference in differences models are one of the […]
People use the terms odds and probability interchangeably in casual usage, but that is unfortunate. It just creates confusion because they are not equivalent. They measure the same thing on different scales. Imagine how confusing it would be if people used degrees Celsius and degrees Fahrenheit interchangeably. "It's going to be 35 degrees today" could really make you dress the wrong way.
by Kim Love and Karen Grace-Martin Statistics terminology is confusing. Sometimes different terms are used to mean the same thing, often in different fields of application. Sometimes the same term is used to mean different things. And sometimes very similar terms are used to describe related but distinct statistical concepts.

Have you ever wondered why there are so many different types of experimental designs, and how a researcher would go about choosing among them to best address their research questions?
One issue that affects how to interpret regression coefficients is the scale of the variables. In linear regression, the scaling of both the response variable Y, and the relevant predictor X, are both important. In regression models like logistic regression, where the response variable is categorical, and therefore doesn’t have a numerical scale, this only […]
If you’ve been doing data analysis for long, you’ve probably had the ‘AHA’ moment where you realized statistical practice is a craft and not just a science. As with any craft, there are best practices that will save you a lot of pain and suffering and elevate the quality of your work. And yet, it’s […]
Post-hoc tests, pairwise or other linear contrasts, are typical in an analysis of variance (ANOVA) setting to understand which group means differ. They incorporate p-value adjustments to avoid concluding that group means differ when they actually do not. There are several adjustments that can be considered for conducting multiple post-hoc tests, including single-step and stepwise […]

Imputation as an approach to missing data has been around for decades. You probably learned about mean imputation in methods classes, only to be told to never do it for a variety of very good reasons. Mean imputation, in which each missing value is replaced, or imputed, with the mean of observed values of that […]
 stat skill-building compass