new blog post: Member Training: The Dark Side of Data Science

Previous Posts
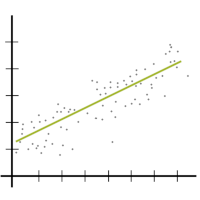
When is it important to use adjusted R-squared instead of R-squared? R², the Coefficient of Determination, is one of the most useful and intuitive statistics we have in linear regression. It tells you how well the model predicts the outcome and has some nice properties. But it also has one big drawback.
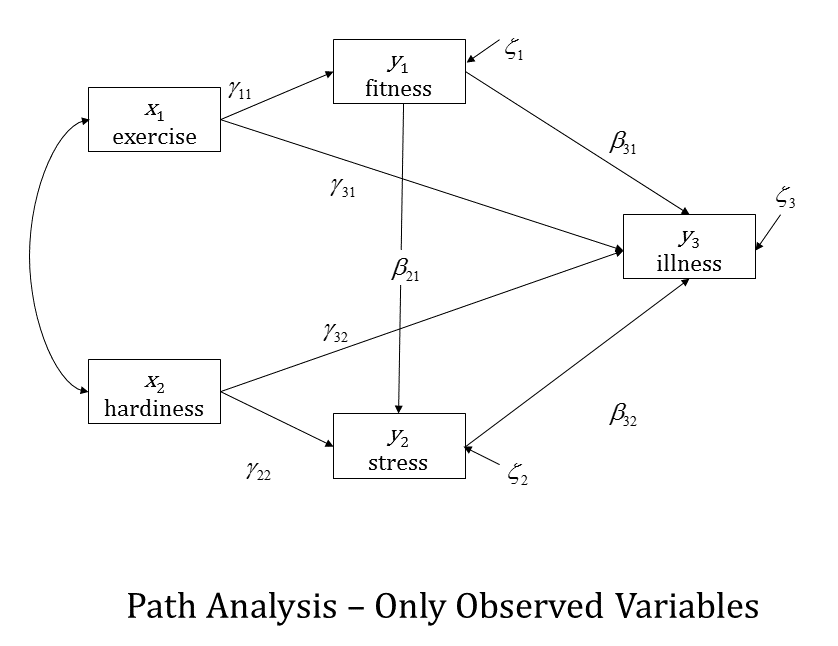
On a previous post (Why do I need to have knowledge of multiple regression to understand SEM?) we showed how a multiple regression model could be conceptualized using Structural Equation Model path diagrams. That's the simplest SEM you can create, but its real power lies in expanding on that regression model. Here I will discuss 4 ways to do that..

Bootstrapping is a methodology derived by Bradley Efron in the 1980s that provides a reasonable approximation to the sampling distribution of various “difficult” statistics. Difficult statistics are those where there is no mathematical theory to establish a distribution.
In most regression models, there is one response variable and one or more predictors. From the model’s point of view, it doesn’t matter if those predictors are there to predict, to moderate, to explain, or to control. All that matters is that they’re all Xs, on the right side of the equation.
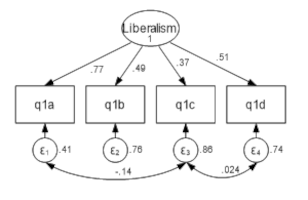
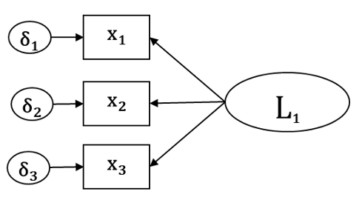
Latent constructs, such as liberalism or conservatism, are theoretical and cannot be measured directly. But we can use a set of questions on a scale, called indicators, to represent the construct together by combining them into a latent factor.Often prior research has determined which indicators represent the latent construct. Prudent researchers will run a confirmatory factor analysis (CFA) to ensure the same indicators work in their sample.
Data analysts can get away without ever understanding matrix algebra, certainly. But there are times when having even a basic understanding of how matrix algebra works and what it has to do with data can really make your analyses make a little more sense.
When your dependent variable is not continuous, unbounded, and measured on an interval or ratio scale, linear models don’t fit. The data just will not meet the assumptions of linear models. But there’s good news, other models exist for many types of dependent variables. Today I’m going to go into more detail about 6 common […]
When we think about model assumptions, we tend to focus on assumptions like independence, normality, and constant variance. The other big assumption, which is harder to see or test, is that there is no specification error. The assumption of linearity is part of this, but it’s actually a bigger assumption. What is this assumption of […]

Recommendations on how to analyze pre-post data can vary. Typical recommendations include regression analysis or matched pairs analysis for within subject studies and analysis of covariance (ANCOVA) or linear mixed effects model analysis for within and between subject studies.
When interpreting the results of a linear regression model, the first step is to look at the regression coefficients. Each term in the model has one. And each one describes the average difference in the value of Y for a one-unit difference in the value of the predictor variable, X, that makes up that term. […]
 stat skill-building compass