Previous Posts
When you draw a graph- either a bar chart, a scatter plot, or even a pie chart, you have the choice of a broad range of colors that you can use. R, for example, has 657 different colors from aliceblue to yellowgreen. SAS has 13 shades of orange, 33 shades of blue, and 47 shades […]
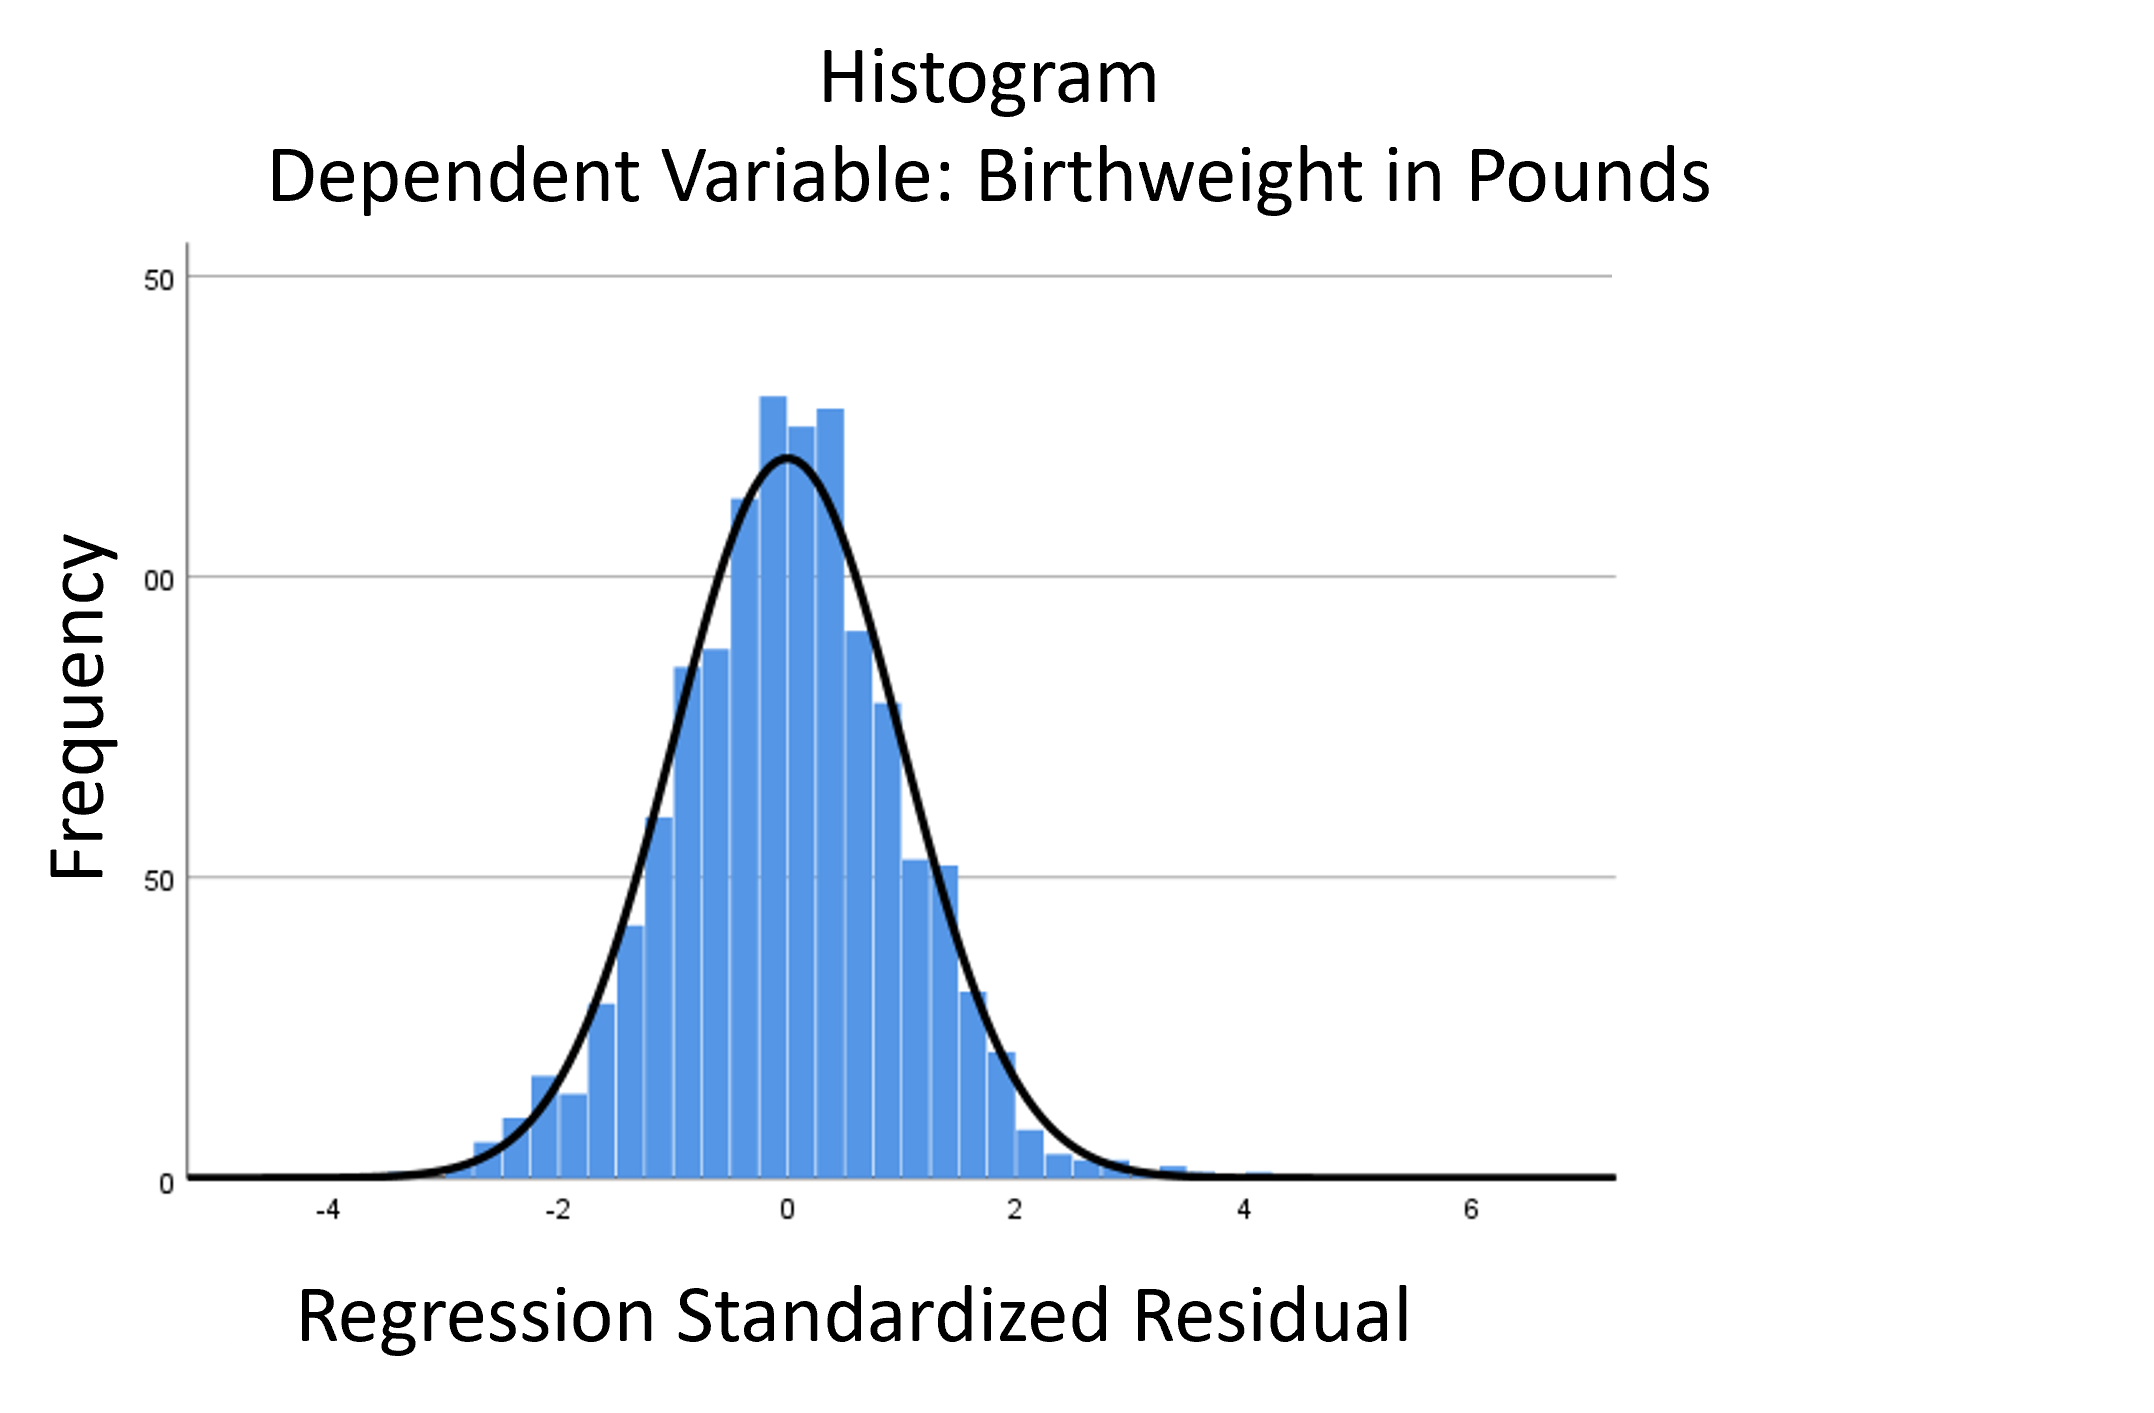
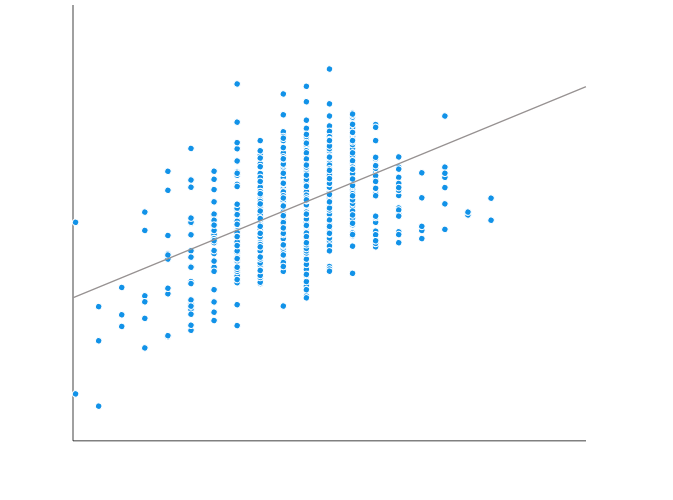
I recently received a great question in a comment about whether the assumptions of normality, constant variance, and independence in linear models are about the residuals or the response variable. The asker had a situation where Y, the response, was not normally distributed, but the residuals were.

The objective for quasi-experimental designs is to establish cause and effect relationships between the dependent and independent variables. However, they have one big challenge in achieving this objective: lack of an established control group.
A well-fitting regression model results in predicted values close to the observed data values. The mean model, which uses the mean for every predicted value, generally would be used if there were no useful predictor variables. The fit of a proposed regression model should therefore be better than the fit of the mean model. But […]
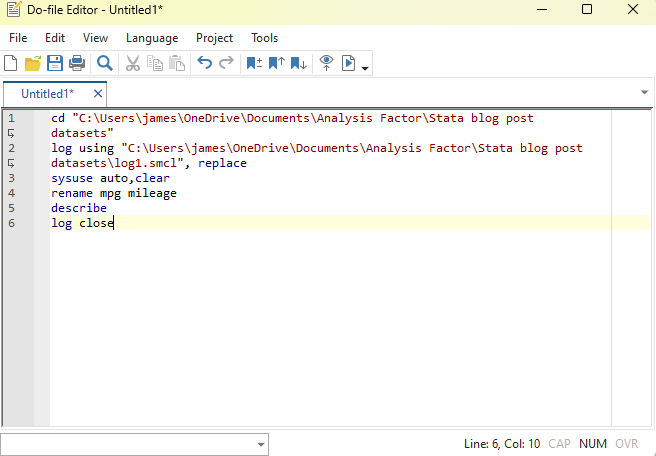
From our first 2 Getting Started with Stata posts, you should be comfortable navigating the windows and menus of Stata. We can now get into the real meat of programming in Stata: do-files. Why Do-Files? A do-file is a Stata file that provides a list of commands to run. You can run an entire do-file […]
Do you ever wish your data analysis project were a little more organized?
Tell me if you can relate to this: You love your field of study, you enjoy asking the big questions and discovering answers. But, when it comes to data analysis and statistics you get a little bogged down. You might even feel a bit lost sometimes. And that is hard to admit. Because after all, […]
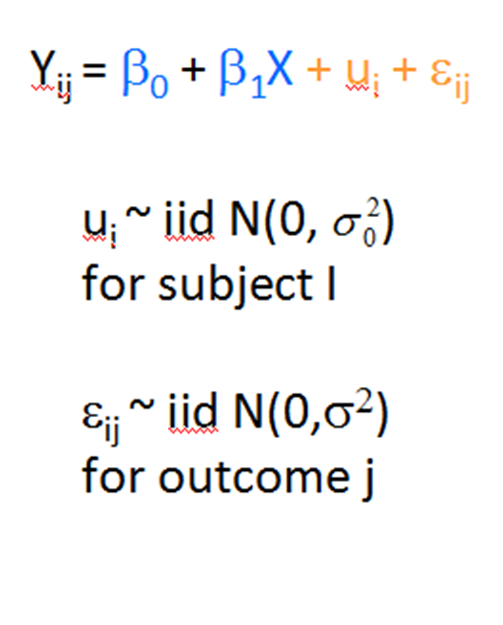
If you have run mixed models much at all, you have undoubtedly been haunted by some version of this very obtuse warning: “The Hessian (or G or D) Matrix is not positive definite. Convergence has stopped.” Or “The Model has not Converged. Parameter Estimates from the last iteration are displayed.” What on earth does that mean?
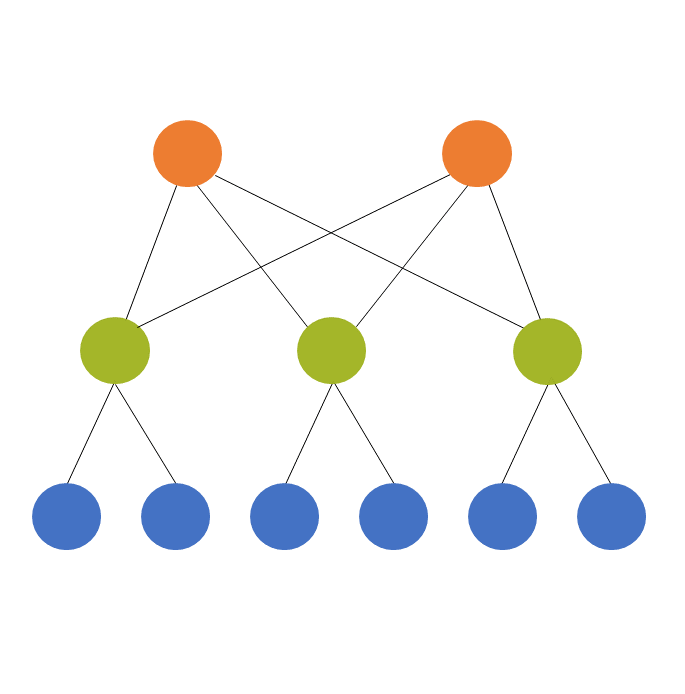
One of those tricky, but necessary, concepts in statistics is the difference between crossed and nested factors. As a reminder, a factor is any categorical independent variable. In experiments, or any randomized designs, these factors are often manipulated. Experimental manipulations (like Treatment vs. Control) are factors. Observational categorical predictors, such as gender, time point, poverty […]
 stat skill-building compass