 A multiple regression model could be conceptualized using Structural Equation Model path diagrams. That’s the simplest SEM you can create, but its real power lies in expanding on that regression model. Here I will discuss four types of structural equation models.
Path Analysis
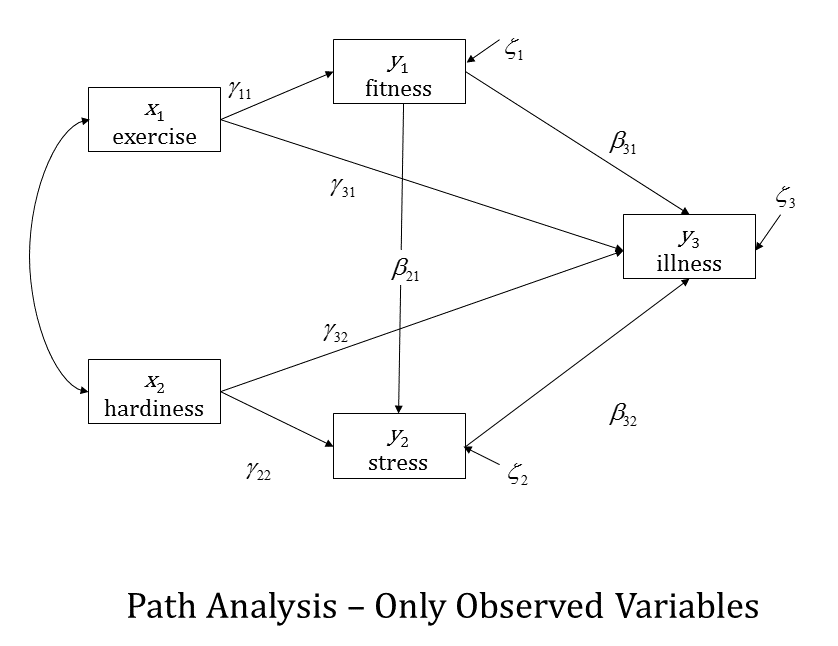
More interesting research questions could be asked and answered using Path Analysis. Path Analysis is a type of structural equation modeling without latent variables.
One of the advantages of path analysis is the inclusion of relationships among variables that serve as predictors in one single model.
One specific and common example is a mediation model. Even though it is not the only way of assessing mediation, it is a very intuitive and efficient one.
This model here shows a few different mediational relationships. One is the relationship between Exercise and Illness. You can see there is a direct path from Exercise to Illness, but there is also a mediated path that goes through Fitness.
This model is asserting that at least part of the effect of Exercise on Illness is that Exercise affects Fitness, and Fitness, in turn affects Illness.
(click any of the following graphics to see them larger)
Confirmatory Factor Analysis
Although we often think of of Confirmatory Factor Analysis (CFA) as data reduction, it’s actually one of the core types of structural equation models. I learned about Exploratory Factor Analysis before CFA, and still use both in most of the projects I’m involved in.
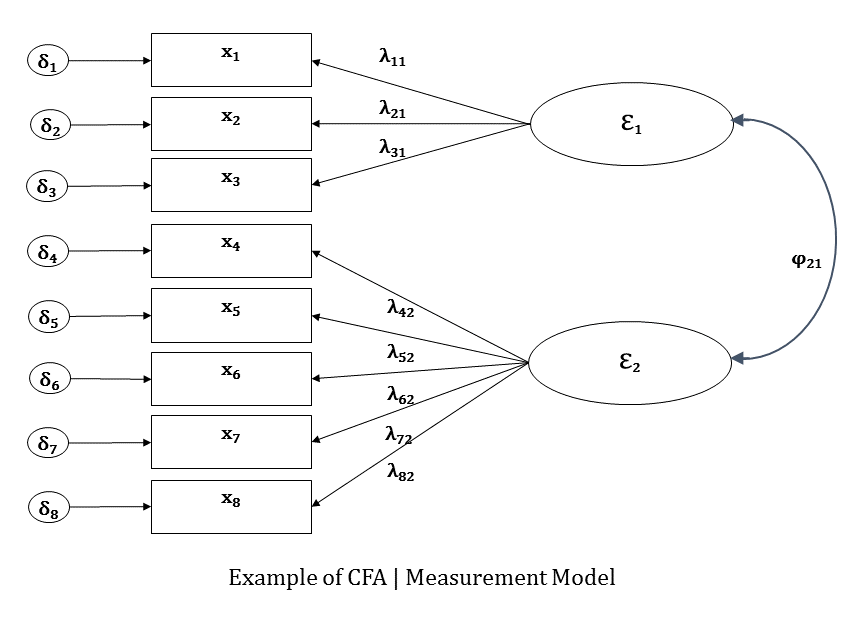
CFA made me think, at the beginning, of a full “targeted” EFA. Basically, you only estimate the paths that link each indicator (aka observed variable) to their corresponding factor (aka latent variable).
CFA is still a bit exploratory, the confirmatory really speaks to the knowledge you have of the theory behind the relationship between the constructs (represented by factors) and their observed indicators. Here is a simple path diagram of a two-factor CFA:
CFA is also known within SEM as the measurement model. It is the step taken to determine how the factors (ε1 and ε1) are measured by the indicators (x1 to x8).
Latent Variable Structural Model
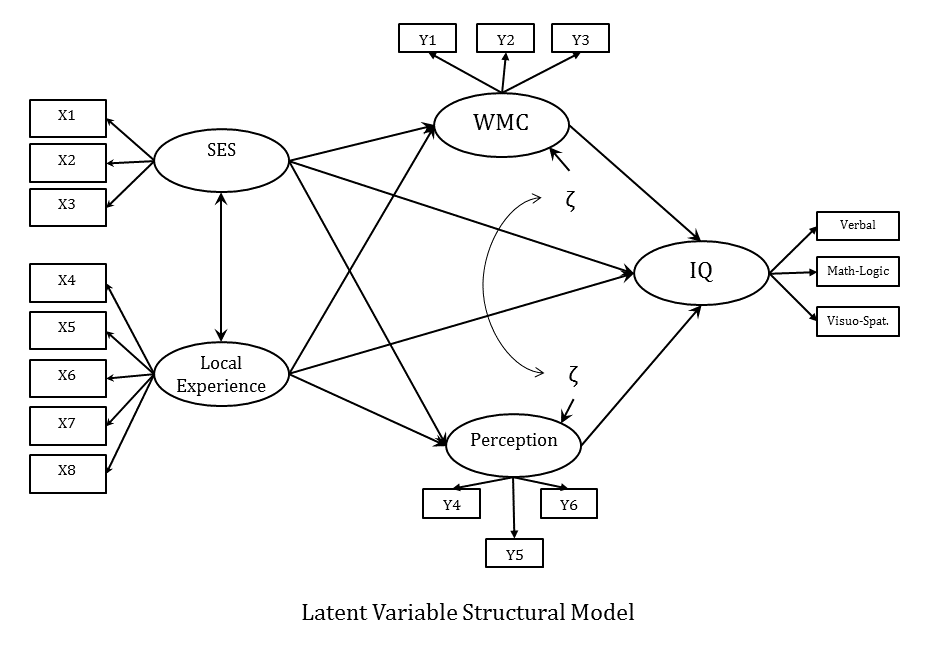
The next step is to fit the structural model, which is what you probably think of when you hear about SEM. It is mainly using the measured latent variables within the path analysis framework.
Once you have declared the latent variables you can hypothesize and test their relationships. Here is an example of a full latent variable structural equation model (notice the similarity with the example of path analysis above):
Growth Curve Models
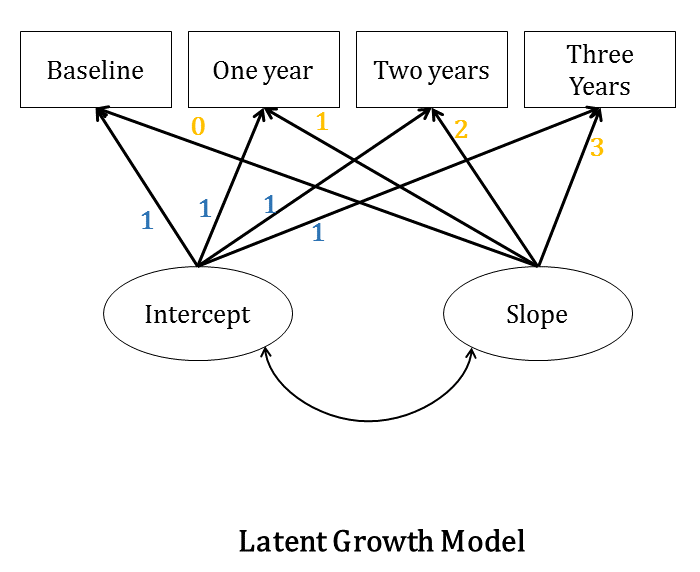
Another popular application of Structural Equation Modeling is longitudinal models, commonly referred to as Growth Curve Models. Provided you have multiple observations of the same variable over time, you can declare an intercept and a slope for the subjects’ trajectories over time as latent variables by constraining the path coefficients in a specific way (see diagram below).
Because the paths are constrained, we are attempting to estimate on growth curve modeling the means of the latent variables. These means give us the overall intercept and the overall slope across all subjects.
Latent Growth Curve Models are related to and an alternative to running Mixed Models on longitudinal data. These mixed models are often called Individual Growth Curve Models.
By Manolo Romero Escobar


Possibly the best and most illustrative description of SEM I have read to date. A truly excellent post. Thank you
I get various knowledge about structural equation modeing from this reference.This reference benefit for my research.
Great collection with thematic presentation.
I want to use structural equation models for to identify various factors that affect strategy implementation most significantly.
interested in structural equation modeling