Previous Posts
Survey questions are often structured without regard for ease of use within a statistical model. Take for example a survey done by the Centers for Disease Control (CDC) regarding child births in the U.S. One of the variables in the data set is “interval since last pregnancy”. Here is a histogram of the results.
Both multinomial and ordinal models are used for categorical outcomes with more than two categories. The simplest decision criterion is whether that outcome is nominal (i.e., no ordering to the categories) or ordinal (i.e., the categories have an order). It should be that simple. Here’s why it isn’t.
You probably learned about the four levels of measurement in your very first statistics class: nominal, ordinal, interval, and ratio. Knowing the level of measurement of a variable is crucial when working out how to analyze the variable. Failing to correctly match the statistical method to a variable’s level of measurement leads either to nonsense […]
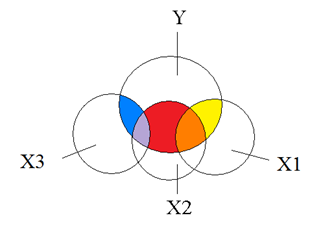
Multicollinearity can affect any regression model with more than one predictor. It occurs when two or more predictor variables overlap so much in what they measure that their effects are indistinguishable. When the model tries to estimate their unique effects, it goes wonky (yes, that’s a technical term). So for example, you may be interested in […]
At times it is necessary to convert a continuous predictor into a categorical predictor. For example, income per household is shown below. This data is censored, all family income above $155,000 is stated as $155,000. A further explanation about censored and truncated data can be found here. It would be incorrect to use this variable […]
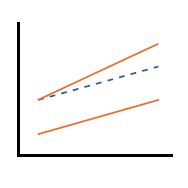
What’s a good method for interpreting the results of a model with two continuous predictors and their interaction? Let’s start by looking at a model without an interaction. In the model below, we regress a subject’s hip size on their weight and height. Height and weight are centered at their means.
Choosing statistical software is part of The Fundamentals of Statistical Skill and is necessary to learning a second software (something we recommend to anyone progressing from Stage 2 to Stage 3 and beyond). You have many choices for software to analyze your data: R, SAS, SPSS, and Stata, among others. They are all quite good, but […]
One approach to model building is to use all predictors that make theoretical sense in the first model. For example, a first model for determining birth weight could include mother’s age, education, marital status, race, weight gain during pregnancy and gestation period. The main effects of this model show that a mother’s education level and […]
My poor colleague was pulling her hair out in frustration today. Here's what happened: She was trying to import an Excel spreadsheet into SAS, and it didn’t work. Here's what to do.
The expression “can’t see the forest for the trees” often comes to mind when reviewing a statistical analysis. We get so involved in reporting “statistically significant” and p-values that we fail to explore the grand picture of our results. It’s understandable that this can happen. We have a hypothesis to test. We go through a […]


 stat skill-building compass