Previous Posts
Ever hear this rule of thumb: “The Chi-Square test is invalid if we have fewer than 5 observations in a cell”. I frequently hear this mis-understood and incorrect “rule.” We all want rules of thumb even though we know they can be wrong, misleading, or misinterpreted. Rules of Thumb are like Urban Myths or like […]
An extremely useful area of statistics is a set of models that use latent variables: variables whole values we can’t measure directly, but instead have to infer from others. These latent variables can be unknown groups, unknown numerical values, or unknown patterns in trajectories.
Repeated measures is one of those terms in statistics that sounds like it could apply to many design situations. In fact, it describes only one. A repeated measures design is one where each subject is measured repeatedly over time, space, or condition on the dependent variable. These repeated measurements on the same subject are not […]
Data Cleaning is a critically important part of any data analysis. Without properly prepared data, the analysis will yield inaccurate results. Correcting errors later in the analysis adds to the time, effort, and cost of the project.
No, degrees of freedom is not “having one foot out the door”! Definitions are rarely very good at explaining the meaning of something. At least not in statistics. Degrees of freedom: “the number of independent values or quantities which can be assigned to a statistical distribution”. This is no exception.
The Kappa Statistic or Cohen’s* Kappa is a statistical measure of inter-rater reliability for categorical variables. In fact, it’s almost synonymous with inter-rater reliability. Kappa is used when two raters both apply a criterion based on a tool to assess whether or not some condition occurs. Examples include:
In the world of statistical analyses, there are many tests and methods that for categorical data. Many become extremely complex, especially as the number of variables increases. But sometimes we need an analysis for only one or two categorical variables at a time. When that is the case, one of these seven fundamental tests may […]
There are important ‘rules’ of statistical analysis. Like Always run descriptive statistics and graphs before running tests Use the simplest test that answers the research question and meets assumptions Always check assumptions. But there are others you may have learned in statistics classes that don’t serve you or your analysis well once you’re working with […]
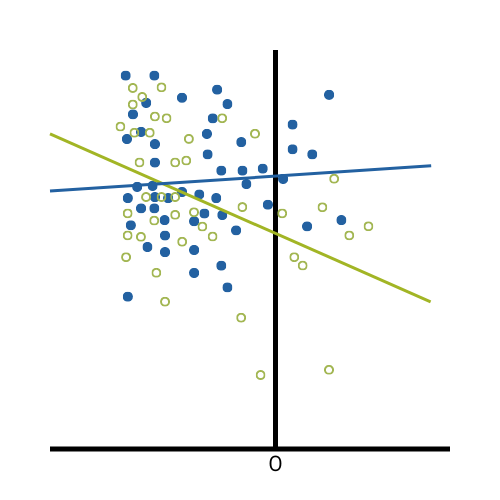
The scatterplot is a simple display of the relationship between two, or sometimes three, variables. You have a wide range of options for displaying a scatterplot. In particular, you can control the location, size, shape, and color of the points in your scatterplot.
Of all the stressors you’ve got right now, accessing your statistical software from home shouldn’t be one of them. (You know, the one on your office computer). We’ve gotten some updates from some statistical software companies on how they’re making it easier to access the software you have a license to or to extend a […]


 stat skill-building compass