Previous Posts
A Gentle Introduction to Random Slopes in Multilevel Modeling …aka, how to look at cool interaction effects for nested data. Do the words “random slopes model” or “random coefficients model” send shivers down your spine? These words don’t have to be so ominous. Journal editors are increasingly asking researchers to analyze their data using this […]
Have you ever compared the list of model assumptions for linear regression across two sources? Whether they’re textbooks, lecture notes, or web pages, chances are the assumptions don’t quite line up. Why? Sometimes the authors use different terminology. So it just looks different. And sometimes they’re including not only model assumptions, but inference assumptions and […]
Few data sets are completely balanced, with equal sample sizes in every condition. But are they really the scary problem your stats professor made them out to be? Only sometimes.
Missing data causes a lot of problems in data analysis. Unfortunately, some of the “solutions” for missing data cause more problems than they solve.
When our outcome variable is the frequency of occurrence of an event, we will typically use a count model to analyze the results. There are numerous count models. Regardless of the model we use, there is a very important prerequisite that they all share. We must identify the period of time or area of space in which the counts were generated. We must model exposure.
In generalized linear models, there is a link function, which is the link between the mean of Y on the left and the fixed component on the right. In order to make the model fit in a linear form for these other distributions, we often need to take some function of the mean.
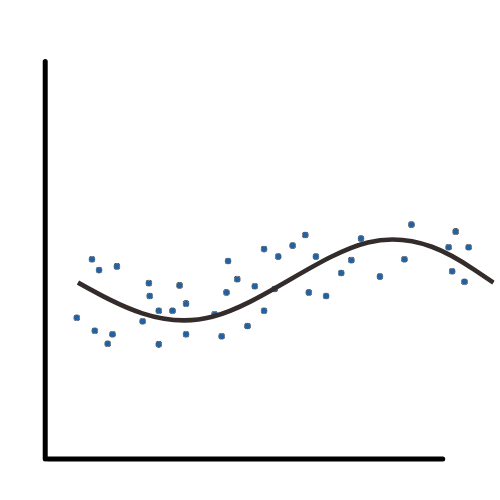
You think a linear regression might be an appropriate statistical analysis for your data, but you’re not entirely sure. What should you check before running your model to find out?
Creating a quality scale for a latent construct (a variable that cannot be directly measured with one variable) takes many steps. Structural Equation Modeling is set up well for this task. One important step in creating scales is making sure the scale measures the latent construct equally well and the same way for different groups […]
Mean imputation: So simple. And yet, so dangerous. Perhaps that’s a bit dramatic, but mean imputation (also called mean substitution) really ought to be a last resort. It’s a popular solution to missing data, despite its drawbacks. Mainly because it’s easy. It can be really painful to lose a large part of the sample you […]
Open data, particularly government open data is a rich source of information that can be helpful to researchers in almost every field, but what is open data? How do we find what we’re looking for? What are some of the challenges with using data directly from city, county, state, and federal government agencies?
 stat skill-building compass