Relative Risk and Odds Ratios are often confused despite being unique concepts. Why?
Well, both measure association between a binary outcome variable and a continuous or binary predictor variable.
And unfortunately, some people use the names interchangeably. They shouldn’t be because they have different interpretations. So it’s important to keep them separate and to be precise in the language you use.
The basic difference is that the odds ratio is a ratio of two odds (yep, it’s that obvious) whereas the relative risk is a ratio of two probabilities. (The relative risk is also called the risk ratio). Let’s look at an example.
Relative Risk/Risk Ratio
Suppose you have a school that wants to test out a new tutoring program. At the start of the school year they impose the new tutoring program (treatment) for a group of students randomly selected from those who are failing at least 1 subject at the end of the 1st quarter. The remaining students receive the customary academic support (control group).
At the end of the school year the number of students in each group who fail any of their classes is measured. Failing a class is considered the outcome event we’re interested in measuring. From these data we can construct a table that describes the frequency of two possible outcomes for each of the two groups.
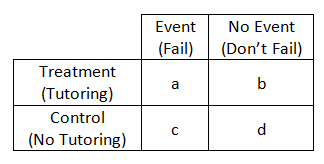
The probability of an event in the Treatment group is a/(a+b)= R1 . It’s the number of tutored students who experienced an event (failing a class) out of the total number of tutored students. You can think of it this way, if a student is tutored, what is the probability (or risk) of failing a class?
Likewise, the probability of an event in the Control group is c/(c+d) = R2. Again, it’s just the number of untutored students experienced an event out of the total number of untutored students.
Although each of these probabilities (i.e., risks) is itself a ratio, this isn’t the risk ratio. To measure the effect of the tutoring, compare the risk of failing in the tutored students to the risk in the untutored students.
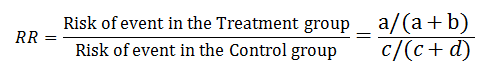
The ratio of these two probabilities R1/R2 is the relative risk or risk ratio. Pretty intuitive.
If the program worked, the relative risk should be smaller than one, since the risk of failing should be smaller in the tutored group.
A relative risk of 1 says the tutoring made no difference at all. If it’s above 1, then the tutored group actually had a higher risk of failing than the controls.
Odds Ratios
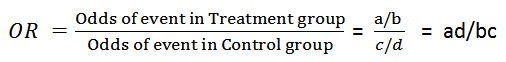
The odds ratio is the ratio of the odds of an event in the Treatment group to the odds of an event in the control group. The term ‘Odds’ is commonplace, but not always clear, and often used inappropriately.
The odds of an event is the number of events / the number of non-events.
This turns out to be equivalent to the probability of an event/the probability of a non-event.
You’ll often see odds written as P/(1-P).
So for example, in the Treatment group, the odds of an event is the number of tutored students who failed a class/the number of students in the tutored group who passed all their classes.
The numerator is the same as that of a probability, but the denominator here is different. It’s not a measure of events out of all possible events. It’s a ratio of events to non-events. You can switch back and forth between probability and odds—both give you the same information, just on different scales.
If O1 is the odds of event in the Treatment group and O2 is the odds of event in the control group then the odds ratio is O1/O2. Just like the risk ratio, it’s a way of measuring the effect of the tutoring program on the odds of an event.
Compare this to RR which is the probability of an event occurring (a/a+b)/the probability of the event not occurring (c/c+d).
So as you can see, which both relative risk and odds ratios tell you about the change in how likely an outcome is at different values of a predictor, they do it slightly differently.
Go to the next article or see the full series on Easy-to-Confuse Statistical Concepts
References and Further Reading:
- Case-Control Studies: Design, Conduct, Analysis (Monographs in Epidemiology and Biostatistics) 1st Edition James J. Schlesselman
- Foundations of Epidemiology 2nd Edition Lilienfeld and Lilienfeld.
- Essentials of Biostatistics. Robert C. Elston and William D. Johnson 1994
- Why use Odds Ratios in Logistic Regression
- Understanding Probability, Odds, and Odds Ratios in Logistic Regression

Good Evening
Can you please do a calculation for ambispective cohort studies, which formula do we use?
It is good!! But it is better to give more relevant scenario to the subject, like “vaccinated Vs not…Exposed Vs not…
thanks
TYSM 🙂
Thanks, really helpful.
A very easy and helpful explanation indeed. What i fail to understand though is how an OR is better than the RR. If the difference between the size of Treatment and Control is significatly large would it not make the OR misleading?
For cohort studies (i.e. retrospective, ambispective, prospective), I usually use RRs as long as I have a clear idea of the temporality of my X’s and Y’s. If I cannot establish which variable comes first or comes last (i.e. heart failure vs kidney failure), I usually use ORs.
Thanks a lot explained in an easy and understandable way
Wonderful and easy way explanation. Thank u!
Thanks for the explanation
very well <3
Thank you. Easy and helpful explanation
you have mean of OR ?
if have then email plz.
thanks for this lucid explanation. this query is about the last sentence. do you mean to say the RRR is probability of an event occurring (a/a+b) among treatment group/the probability of the event occurring (c/c+d) among control group?
I am also confused. Pleae explain
You sure are perfectly right…
RR is the probability of an event occurring in the treatment group (a/a+b)/the probability of an event occurring in the control or comparison group (c/c+d).
its good information.. thanks
Thank you! It was very helpful in understanding RR and OR. Examples were brilliant.
Why can’t a probability ratio used instead of odds ratio.. is there any specific advantage…
Chandraraju,
Some people do use the probability ratio, aka the relative risk. The disadvantage of it is the RR is not a constant effect of X. Only the odds ratio is. The probability ratio changes depending on the value of X. So if you want to know how X affects Y, odds ratios are the best summary measure.
Great explanation, Audrey. What about if you do not have a control group in your data set. In a retrospective cohort study, how could one obtain an odds ratio?
Waoh! So nice explanations , they are very helpful to understand the OR and RR, Thank you
Thanks for giving very simple explanation , quick question is there any special application of OR in practical life where RR is not suitable?
The short answer, at least in classic epidemiological research, is that OR are used for retrospective studies/Case control studies and RR is used for prospective studies. When the ‘Rare Disease’ assumption holds (meaning very low prevalence which means few existing cases), the OR and the RR are very close to each other and the OR is considered a good surrogate for the RR
Thank you. a simple explanation to differentiate RR vs OR.
Thanks! This was very helpful to distinguish RR and OR.
Really helpful. Thank
your explanation was really helpful and clear. Thank you for posting