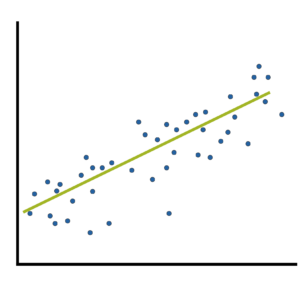
 A well-fitting regression model results in predicted values close to the observed data values. The mean model, which uses the mean for every predicted value, generally would be used if there were no useful predictor variables. The fit of a proposed regression model should therefore be better than the fit of the mean model. But how do you measure that model fit?
R-squared
Beyond R-squared: Assessing the Fit of Regression Models
February 20th, 2024 by Karen Grace-MartinTwo Types of Effect Size Statistic: Standardized and Unstandardized
June 26th, 2023 by Karen Grace-MartinEffect size statistics are all the rage these days.
Journal editors are demanding them. Committees won’t pass dissertations without them.
But the reason to compute them is not just that someone wants them — they can truly help you understand your data analysis.
What Is an Effect Size Statistic?
 When many of us hear “Effect Size Statistic,” we immediately think we need one of a few statistics: Eta-squared, Cohen’s d, R-squared.
“… information about the magnitude and direction of the difference between two groups or the relationship between two variables.”
– Joseph A. Durlak, “How to Select, Calculate, and Interpret Effect Sizes”
If you think about it, many familiar statistics fit this description. Regression coefficients give information about the magnitude and direction of the relationship between two variables. So do correlation coefficients. (more…)
The Difference Between R-squared and Adjusted R-squared
August 22nd, 2022 by Karen Grace-MartinWhen is it important to use adjusted R-squared instead of R-squared?
R², the Coefficient of Determination, is one of the most useful and intuitive statistics we have in linear regression.
It tells you how well the model predicts the outcome and has some nice properties. But it also has one big drawback.
Simplifying a Categorical Predictor in Regression Models
January 14th, 2020 by Jeff MeyerOne of the many decisions you have to make when model building is which form each predictor variable should take. One specific version of this decision is whether to combine categories of a categorical predictor.
The greater the number of parameter estimates in a model the greater the number of observations that are needed to keep power constant. The parameter estimates in a linear (more…)
Member Training: The Anatomy of an ANOVA Table
December 31st, 2019 by Jeff Meyer
Our analysis of linear regression focuses on parameter estimates, z-scores, p-values and confidence levels. Rarely in regression do we see a discussion of the estimates and F statistics given in the ANOVA table above the coefficients and p-values.
And yet, they tell you a lot about your model and your data. Understanding the parts of the table and what they tell you is important for anyone running any regression or ANOVA model.
Can a Regression Model with a Small R-squared Be Useful?
May 14th, 2012 by Karen Grace-Martin R² is such a lovely statistic, isn’t it? Unlike so many of the others, it makes sense–the percentage of variance in Y accounted for by a model.
I mean, you can actually understand that. So can your grandmother. And the clinical audience you’re writing the report for.
A big R² is always good and a small one is always bad, right?
Well, maybe. (more…)
