The field of statistics has a terminology problem.
It affects students’ ability to learn statistics. It affects researchers’ ability to communicate with statisticians; with collaborators in different fields; and of course, with the general public.
It’s easy to think the real issue is that statistical concepts are difficult. That is true. It’s not the whole truth, though.
This terminology problem makes it even worse.
I first discovered this problem many years ago. I was TAing a statistics class for graduate students in biology, taught in the statistics department. It covered a lot of material in a very short time.
One day in my discussion section we were covering the meaning of the intercept and the slope in a simple regression model. The textbook used alpha to denote the population intercept and beta to denote the population slope. This isn’t the most common notation, but it’s not unheard of either.
One of the students was completely baffled. I asked a lot of questions to understand where she was stuck.
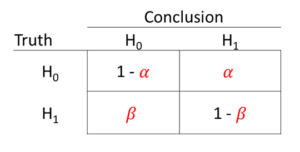
It turns out that only a few weeks before in this class, we’d discussed hypothesis testing. Our text used the following notation for the probabilities of Type I and Type II errors:
That’s right. Same notation, same terms. Completely different definitions.
The poor student was trying to incorporate the new concepts into the definitions of these terms we’d already taught her. Once I explained what was happening, she got it easily.
But I was struck with the absurdity of the situation.
Over the tens of thousands of conversations I’ve had with researchers since then, I’ve discovered other examples of terminology that confuses all of us, as well as four types of confusing terminology.
1. Single Terms with Multiple Meanings in Statistics
We’ve already seen a good example of this phenomenon, and there are many more.
It turns out that beta has a few other common uses within statistics. We’ve already seen two definitions:
1. population regression coefficients (unstandardized)
2. the probability of a Type II error.
Third, some statistical software uses beta as the label for standardized regression coefficient estimates.
And fourth, there is a beta distribution. It’s not used a lot, but one type of generalized linear model based on this distribution is called Beta Regression. It’s used for proportion data.
Of course, Beta regression (definition 4) has population regression coefficients (definition 1). Estimates of these coefficients could be standardized (definition 3). Tests of these coefficients have a probability of Type II error (definition 2). I mean, wow.
2. Terms with Colloquial Meanings in English and Technical Definitions in Statistics
Another area of confusion is terms with a different technical meaning in statistics than the colloquial meaning in English. Sometimes the meanings are similar enough that the distinction can be hard to grasp.
A good example of this is the term Error. Colloquially, error is a mistake. It’s not good.
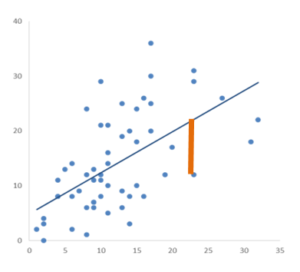
But in a regression model, the error is simply the distance between the actual value of an outcome variable and the predicted value. It’s not bad. In fact, it’s a fundamental and necessary part of regression models.
(As it turns out, there are other meanings of error in statistics. So this one also fits in our first type of confusing terms).
3. Similar Terms with Nuanced Meanings
Then there are similar-sounding terms with distinct meanings in statistics. We may use them in the same context, but they are not, in any way, interchangeable.
Take General Linear Model and Generalized Linear Model. A General Linear Model is the class of models made up of linear regression and ANOVA. It has a key assumption of errors that follow a normal distribution and it models the relationship between one or more predictor variables, X, and a continuous outcome variable Y.
A Generalized Linear Model is a little different. It too is a regression model, but the outcome is not Y, but a function of Y (called a link function). It also allows for an expanded family of distributions for Y|X, including the Poisson, binomial, and beta(!).
To make it a little more confusing, a General Linear Model is one type of Generalized Linear Model. So while you cannot use a General Linear Model procedure in your software to run most Generalized Linear Models, the reverse is not true.
4. Multiple Terms with One Basic Meaning
And then there are the single concepts with many names. Sometimes there are nuances in the way the different terms are used. But these nuances can be so subtle that we use the terms interchangeably (even when perhaps we shouldn’t). And sometimes there are just different terms in different fields of application.
An example is the type of model that includes both fixed and random effects. I generally call these mixed models, but there are many names. Here are just a few:
- Multilevel Models
- Hierarchical Linear Models
- Linear Mixed Effects Models
- Random Effects Models
- Random Coefficient Models
- Individual Growth Curve Models
Are there nuanced differences? Sure. But these differences mostly describe the specific data design to which the model is applied and the notation used to describe it.
They aren’t mathematically distinct and you’re going to use the exact same procedure within the software of your choice to run them all.
Suggestions for Better Communication
Many of these terms are too ingrained to change effectively. So when communicating with clients, collaborators, or colleagues, try one or more of the following:
- Acknowledge this is confusing for everyone and your understanding of a term isn’t the only right one.
- Choose your words carefully.
- Define how you’re using your terms.
- Ask lots of questions if you don’t understand what someone means.


The examples are just a sample the nomenclature problems: “bias,” “confidence interval” all invite confusion. Much worse, in frequentist statistics all of the guarantees are about the limit of infinite samples. They guarantee (and in limiting frequentist interpretations, say) exactly nothing about the the values of variables in any finite sample (and they are all finite) one may have. In truth, statistical inferences are mostly guessing about the observable future or about parameters in unobservable probability distributions.
This is great contemplation for us statisticians. Thank you….
Let’s not forget the proliferation of terms pretending to add nuance to the idea of “variable.” The forces of data commerce have even driven people to new heights of rationalization for the need of new words that mean “category” (“binning” anyone?). It was bad enough before data “science” arrived. Now marketing is driving strategies of differentiation through verbal proliferation. Yuck.
Superb post, and suggestions for better communication. You would think that textbooks at least would start to standardize some of this nomenclature.
remember asking our instructor why in the world are we using the same letter to denote a random variable and an observed value.
samea s anything result value with other statistic or matematics like I give example x excel 9,3 and NCSS 2010 9,342 and the mathematic matric and table simplex same as 9,31 . How data 9,3 same as average like other SPSS (surface mopdel) 9,3 with statistic SPSS
Very informative topic. Tanks
Tareq
My favorite example of confusing statistics notation was “P(X = x)” lol!
I remember asking our instructor why in the world are we using the same letter to denote a random variable and an observed value?!
That’s a great one, Robert. So true!