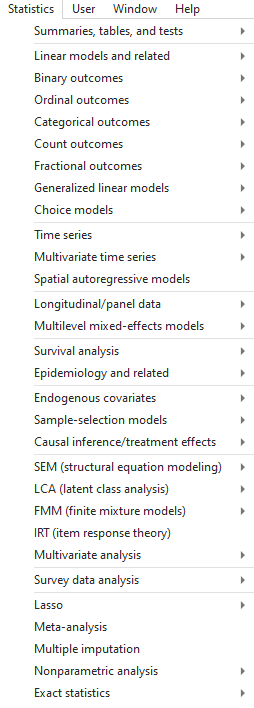
In part 3 of this series, we explored the Stata graphics menu. In this post, let’s look at the Stata Statistics menu.
Statistics Menu

Let’s use the Statistics menu to see if price varies by car origin (foreign).
We are testing whether a continuous variable has a different mean for the two categories of a categorical variable. So we should do a 2-sample t-test.
Say we want to use a 90% confidence level, and we have reason to suspect the two groups have unequal variance.
Click Statistics -> Summaries, tables, and tests -> Classical tests of hypothesis -> t test (mean-comparison test).
We want a Two-sample using groups. Put “price: for Variable name and “foreign” for Group variable name.
We click the Unequal variances button in the Main tab to make the variances of the two groups distinct, then change the Confidence level to 90%, and press OK.
Stata outputs the following code:
ttest price, by(foreign) unequal level(90)
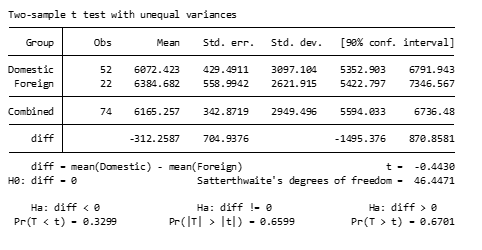
and the following table:

This statistics tab can be used for all sorts of tests and analysis, such as regressions, generalized linear models, variable summaries, z-tests, and much more. Go ahead and look through the menu to get an idea of what’s available.
But now that you know how to use the menus, we’re not going to use them much in the rest of this series.
As a general rule, it is typically better to use do-files for our analysis, and only use the menus for helping to find the right code to put into our do-files.
by James Harrod
About the Author: James Harrod interned at The Analysis Factor in the summer of 2023. He plans to continue into a career as an actuary, and hopes to continue finding interesting ways of educating people about statistics. James is well-versed in R and Stata programming and enjoys teaching the intuition behind common statistical methods. James is a 2023 graduate of the University of Rochester with bachelor’s degrees in Statistics and Economics.


Leave a Reply