If you learned much about calculating power or sample sizes in your statistics classes, chances are, it was on something very, very simple, like a z-test.
But there are many design issues that affect power in a study that go way beyond a z-test. Like:
- repeated measures
- clustering of individuals
- blocking
- including covariates in a model
Regular sample size software can accommodate some of these issues, but not all. And there is just something wonderful about finding a tool that does just what you need it to.
Especially when it’s free.
Enter Optimal Design Plus Empirical Evidence software.
Optimal Design is software for power calculations on individual and group randomized trials. It was developed by a group of statistical researchers, headed by Jessaca Spybrook at Western Michigan University. It was funded by a grant from the William T. Grant Foundation, so it is available for download free of charge. (Link below).
I found it recently when working with a client who is planning a study for the effectiveness of an educational intervention. The design options in the software were exactly the design issues we needed to consider for developing the best design to maximize power while accounting for data collection limitations and the budget.
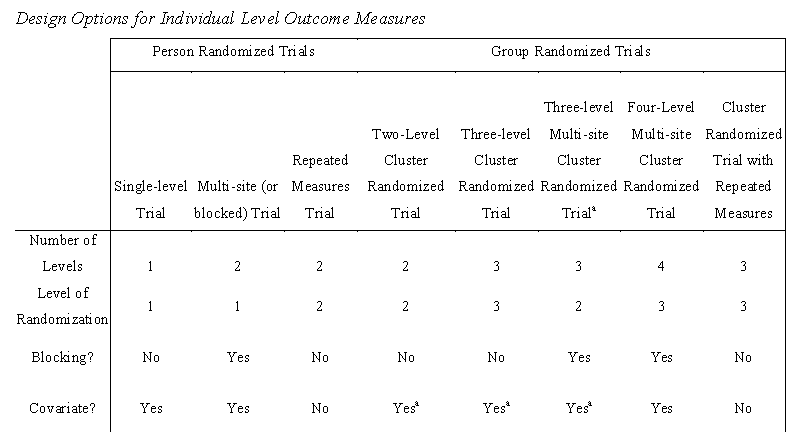
There are many design options for a randomized trial. If randomized trial isn’t a term used in your field, this is the basic idea.
The outcome is measured at the individual level, and repeated measures on individuals are possible. There is some sort of randomization to treatment groups, and this randomization can occur at the individual level or at a cluster level. The point of the study is to compare the mean of the outcome in the treatment groups.
For example, educational studies are often conducted on students clustered within classrooms. In a study comparing two teaching formats for effectiveness, usually an entire classroom of students is assigned to one format condition. It’s just not possible to randomly assign individuals within classrooms. So the clusters (classrooms) are randomly assigned to treatment, not the individual student.
So both Person-Randomized and Group-Randomized trials are possible, and the level of randomization affects power.
It is also possible to include a third level of grouping, if classrooms are nested within schools, and a fourth, if schools are blocked within districts.
The randomization to treatments and the measurement of covariates can occur at any level.
If this is starting to get overwhelming, it’s not as bad as it sounds. The software comes with one of the best written statistical software manuals I’ve seen.
The manual explains in great detail, with excellent examples, what each design criteria means, so that you’ll be able to recognize it in your own design.
Here is an excerpt from a table in the manual that explains some of the available designs:
Beyond the very simplest, all of these designs will require using multilevel or mixed models to analyze the data, once you’ve got it. And to run the prospective power analyses, you will have to have estimates for some of the design effects–an intraclass correlation for the clustering, blocking effects, correlations between covariates and the outcome variable–in addition to the usual standard deviation estimates that you need for any power analysis.
But it doesn’t cover the sample size estimates for any multilevel analysis. The effect size it requires is a mean difference for a comparison of two treatments.
This works great if you really are doing this type of intervention study–it’s exactly what you need. And within that context, the design options are plentiful.
Like any specialized tool, it works very, very well for what it’s designed for, and not much else. It’s also very easy to use and well documented.
You can download the Optimal Design Plus software and documentation here.


Hi Karen,
Thank you for you great advise, I really like your website.
I have a power analysis question, for a design for which I can’t find any texts or papers, yet I think more people use something like this. I have an continuous person level repeated outcome measure, and my two treatments are randomized and within groups (instead of the between designs we know from clinical treatments). So any given person will receive treatment A [B], will be measured repeatedly, and will then receive treatment B [A] and will be measured repeatedly again. Can you direct me to any place where I can find a way to calculate the necessary sample size to achieve a power of .8 (with alpha of .05)?
Thank you so much,
Anna
Hmm, I don’t know specifically for that design. There is a paper by Tom Snijders about calculating power for multilevel data. I would suggest starting there.