by Maike Rahn, PhD
Rotations
An important feature of factor analysis is that the axes of the factors can be rotated within the multidimensional variable space. What does that mean?
Here is, in simple terms, what a factor analysis program does while determining the best fit between the variables and the latent factors: Imagine you have 10 variables that go into a factor analysis.
The program looks first for the strongest correlations between variables and the latent factor, and makes that Factor 1. Visually, one can think of it as an axis (Axis 1).
The factor analysis program then looks for the second set of correlations and calls it Factor 2, and so on.
Sometimes, the initial solution results in strong correlations of a variable with several factors or in a variable that has no strong correlations with any of the factors.
In order to make the location of the axes fit the actual data points better, the program can rotate the axes. Ideally, the rotation will make the factors more easily interpretable.
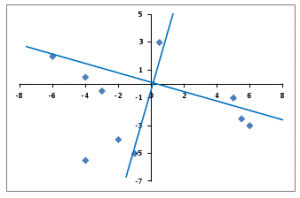
Here is a visual of what happens during a rotation when you only have two dimensions (x- and y-axis):
The original x- and y-axes are in black. During the rotation, the axes move to a position that encompasses the actual data points better overall.
Programs offer many different types of rotations. An important difference between them is that they can create factors that are correlated or uncorrelated with each other.
Rotations that allow for correlation are called oblique rotations; rotations that assume the factors are not correlated are called orthogonal rotations. Our graph shows an orthogonal rotation.
Once again, let’s explore indicators of wealth.
Let’s imagine the orthogonal rotation did not work out as well as previously shown. Instead, we get this result:
| Variables | Factor 1 | Factor 2 |
| Income | 0.63 | 0.14 |
| Education | 0.47 | 0.24 |
| Occupation | 0.45 | 0.22 |
| House value | 0.39 | 0.25 |
| Number of public parks in neighborhood | 0.12 | 0.20 |
| Number of violent crimes per year | 0.21 | 0.18 |
Clearly, no variable is loading highly onto Factor 2. What happened?
Since our first attempt was an orthogonal rotation, we specified that Factor 1 and 2 are not correlated.
But it makes sense to assume that a person with a high “Individual socioeconomic status” (Factor 1) lives also in an area that has a high “Neighborhood socioeconomic status” (Factor 2). That means the factors should be correlated.
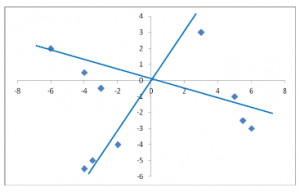
Consequently, the two axes of the two factors are probably closer together than an orthogonal rotation can make them. Here is a display of the oblique rotation of the axes for our new example, in which the factors are correlated with each other:
Clearly, the angle between the two factors is now smaller than 90 degrees, meaning the factors are now correlated. In this example, an oblique rotation accommodates the data better than an orthogonal rotation.


Clear explanation. Thank you.
Simply but very clearly explained. Thank you.
Excellent and simple explanation…. Thanks
This is very helpful for simple understanding. There are other rotation as well, e.g., varimax, direct oblimin, quartimax, equamax, promax, etc. If these rotation can be explained simply as above then that will be very helpful.
Very informative and nicely explained. Thank you.
Best Regards,
Hello. I have a question.
What happens if after a rotation the item correlates to two factors almost equally?
thanks!
If one component extracted, can we use loading of component matrix as rotated component matrix is not possible?
Hi Samir,
Yes.
Thanks Maike, very intuitive introduction!
thanks to your explanation.
Thank you so much, really helpful!
Thank you, excellent explanation
What if there’s 3 factors though?
Very intuitive.
Thanks.
I have Factors and their loading, but how to perform varimax rotation, The most of the tools perfomr the PCA there after rotation. But I only need to perform the varimax rotation
Please provide the help
I really appreciated and understood rotation method to explain correlation with various factors. Thanks Sir
Thank you, very nicely explained – as always
Hi,
May I know how to choose between Direct Oblimin and Promax within oblique rotation?
And Can you please suggest good reading materials / articles to support above description of choosing between orthogonal and oblique rotations and for choice between Direct Oblimin and Promax?
Thank you in advance
There are lots of resources on choosing between Oblique and Orthogonal, but I’ve had a hard time finding any suggestions about choosing among oblique rotations. Jason Osbourne has a nice book on best practices in Factor Analysis. https://www.amazon.com/Best-Practices-Exploratory-Factor-Analysis/dp/1500594342
Nice description,was quite helpful.
thank you
it helped me alot
god bless you
excellent and intuitive explanation thanks
Very good explanation…this way concepts are very clear..
Excellent explanation.
Very clear and useful description, also understandable for non-mathematicians, e.g. linguists.
As much as analysis addresses the most mathematically correct solution it also needs to address the understanding of audiences who make use of the findings. In this way, in conveying results to most organizations (not made up of scientists or statisticians) oblique or non-orthogonal rotations are of limited usefulness. Those who need to use the findings simply do not understand these. The main value of rotation I have found is to distribute the loadings of items more clearly into the factors. Using no rotation typically leads to a large first “everything” factor where most variables load and other small factors that are not distinct. Rotation clarifies the relationships among the variables. Importantly, all orthogonal rotation methods commonly used return results that are effectively the same. My advice to clients therefore always has been, rotate the solution, and unless your audience is very sophisticated, stick with the orthogonal rotations. Any one will work well.
In psych, the variables we use tend to be conceptually related, as said above regarding SES and that of one’s neighbourhood. Oblique is the default for us, most of the time. The visual here is incredibly helpful (page Pin’d ~:-)
My dilemma, is the usefulness of output for PAF FA with oblique rotation, for non-normally distributed data; such as from surveys. Standardised items tend to be skewed; box and whiskers can look like scrambled eggs.
Thanks for the information. I’m using factors analysis but I am unable to interpret the results well. I have both positive and negative loadings. for F1,i have 5 loadings,F2-4,F3-5,F4-2,F5-2,F6-3and F7-2.Kindly guide me on how i should interpret the data
excellent description of rotation… for some reason I could never really understand WHY/WHEN to use each rotation from a mathematical POV. Your piece about the axes being small than 90 degrees makes perfect sense! Thank you!