We often talk about nested factors in mixed models — students nested in classes, observations nested within subject.
But in all but the simplest designs, it’s not that straightforward.
In this webinar, you’ll learn the difference between crossed and nested factors.
We’ll walk through a number of examples of different designs from real studies to pull apart which factors are crossed, which are nested, and which are somewhere in between. We’ll also talk about a few classic designs, like split plots, Latin squares, and hierarchical data.
Particular focus will be on how you can figure all this out in your own design and how it affects how you can and cannot analyze the data.
About the Instructor

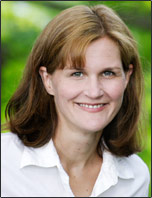
Karen Grace-Martin helps statistics practitioners gain an intuitive understanding of how statistics is applied to real data in research studies.
She has guided and trained researchers through their statistical analysis for over 15 years as a statistical consultant at Cornell University and through The Analysis Factor. She has master’s degrees in both applied statistics and social psychology and is an expert in SPSS and SAS.
Just head over and sign up for Statistically Speaking.
You'll get access to this training webinar, 130+ other stats trainings, a pathway to work through the trainings that you need — plus the expert guidance you need to build statistical skill with live Q&A sessions and an ask-a-mentor forum.

Leave a Reply