I recently received this great question:
Question:
Hi Karen, ive purchased a lot of your material and read a lot of your pdf documents w.r.t. regression and interaction terms. Its, now, my general understanding that interaction for two or more categorical variables is best done with effects coding, and interactions cont v. categorical variables is usually handled via dummy coding. Further, i may mess this up a little but hopefully you’ll get my point and more importantly my question, i understand that
1) given a fitted line Y = b0 + b1 x1 + b2 x2 + b3 x1*x2, the interpretation for b3 is the diff of the effect of x1 on Y, when x2 changes one unit, if x1 and x2 are cont. ( also interpretation can be reversed in terms of x1 and x2).
2) given a fitted line Y = b0 + b1 x1 + b2 x2 + b3 x1*x2, the interpretation for b3 is it affects Y by changing the slope (whereas b2 affects the intercept), if x1 is cont. and x2 is cat 0,1, namely dummy coded. Thus, b1 is not a main effect for x1.
But what was not clear to me is what happens when x1 and x2 are effect coded cat variables, let’s say (-1,1) and the fitted line is Y = b0 + b1 x1 + b2 x2 + b3 x1*x2, the interpretation for b3 is ???? this was only hinted at in the outlines .. I’d like to know how to interpret the b3 in this case, and I’d like to know why in this case of interaction, b1 is still considered a main effect for say x1? Thanks for any clarifications!
Any help would be greatly appreciated,
J
Answer:
Hi J,
Great question. First, yes, everything you state in points 1 and 2 are correct. I would add, though, that the effect-coded coefficients are not all that easy to interpret by themselves. They do give you p-values for true main effects, and that’s useful, but you usually need to interpret using multiple comparison tests of the means.
To answer your questions:
It all comes down to what is a 0 point in dummy and effect coding.
In dummy coding, we’ve set the value of 0 to one of the categories, so:
1. the coefficients reflect actual cell mean differences, and have meaningful interpretations as such
2. when there is an interaction, the value of b1, eg., is the effect of X1 when X2 = 0. Since X2=0 for one category of X2, b1 is not a main effect (an overall effect of X1 across all values of X2). It’s a marginal effect–an effect of X1 at a single value of X2.
In effect coding, we’ve set the value of 0 to being in between the two categories, so:
1. the coefficients are differences between cell means and grand means, and do not have particularly meaningful interpretations. So you can use the p-value to tell that there is a significant interaction, but the only way to interpret that interaction in a meaningful way is to actually look at the means. That’s why we usually just look at F statistics and means in ANOVA, which uses effect coding. The coefficients themselves aren’t very interpretable.
2. when there is an interaction, the value of b1, eg., is the effect of X1 when X2 = 0. Since X2 = 0 at the mean of the two categories of X2, b1 is a main effect. It’s the effect of X1 at the mean value of X2.
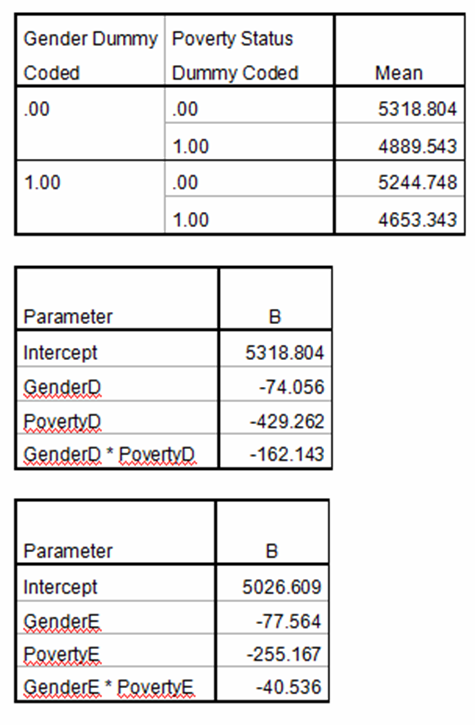
Below, I’ve inserted an example. I’ve displayed the means of each group and the coefficients when the variables are dummy and effect coded.
In dummy coding, the intercept is one of the four means–when both Poverty and Gender=0. The various coefficients are differences from that mean. Grab a calculator and see if you can figure out how to get each mean.
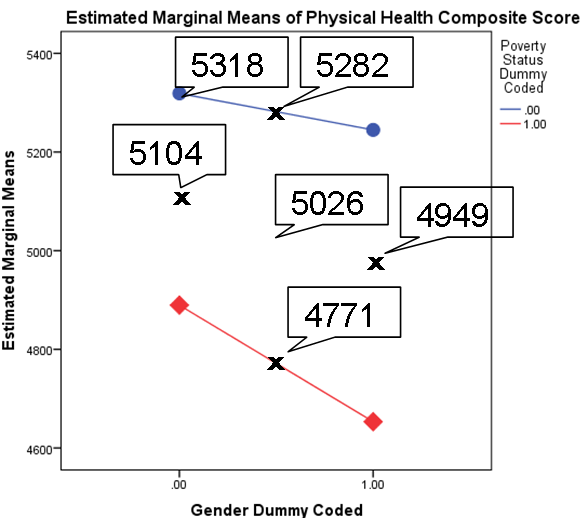
In effect coding, the intercept is the grand mean. That point right in the middle of the graph. The coefficients are differences from that point to the points marked with X on the graph. Once again, see if you can figure out what each coefficient is telling you.


Dear Karen, I have an interaction between 3 variables (one of the variables was effect coded). I later ran it dummy coded as well, to understand the triple interaction. Now I am not sure which one of these models to use in order to plot the results? Is it the effect coded model or the dummy coded one?
Thank you so much for the wonderful and much needed explanations!
Hi Liv,
Either one can work as long as you’re following the coding correctly. I think I would find the dummy one easier.
Hi Karen,
I hope you have heard of Backward difference coding.
Would you know if itis possible to do an interaction if your variables are coded with backward difference coding?
And if so, how would you then interpret this?
With backward difference coding the mean of the dependent variable for a level is compared to the mean of the prior level.
Therefore I wonder if it is possible to even do a interaction with this kind of coding.
Hopefully you know more about this.
Hi Sharon, I haven’t. Do you mean that this is coding of ordinal independent variables? You wouldn’t be coding the dependent.
What is exactly intereaction coding?
Dear Karen, i have a problem in interpreting coefficients of coded categorical factors.i want to understand the effect of supervision, use of quality materials and material handling on waste generation on construction sites. i got this equation using a software “Design Expert”
wastes, %= 12.49+0.2A-0.67B-1.66C-0.63D+0.17AC+0.43BC-0.69BD-0.087CD-0.41BCD
A=quantity of materials used
B=material handling(coded as Reuse=1, no reuse=0)
C=Quality of material(coded as Good=1, not good=0)
D=Supervision(coded as Strict=1, not strict=0)
Now i want to know how for example what effect will material handling have on wastes when other factors are constant, or the effect of interaction between quality and supervision.
I will be very grateful to hear from you.
Hi,
I wonder what if there is an interaction between two dummies, how to determine the effect on Y?
lets say: y = b0+ b1*D1 +b2*D2+ b3*D1*D2
Y is wage, D1 is gender=1 for male and D2 is martial position = 1 for married, therefore the interaction represents married male.
Thank you
Nahla, the interaction represents not just married male. Its the difference in the marital difference for males compared to females.
In other words it’s: (MaleMarried – MaleSingle) – (FemaleMarried – FemaleSingle).
It tells you how much more marriage affects males than it does females.
What a wonderfully worded answer!! Made my Day
Thank you for a wonderful resource for those of us needing to explain (and understand) the gist of key stat methods (my background is math not stat). In your description “interpreting interactions between two effect-coded categorical predictors” you say under the heading of Effect Coding, that “2. when there is an interaction, the value of b1, eg., is the effect of X1 when X2 = 0. Since X2 = 1 at the mean of the two categories of X2, b1 is a main effect. It’s the effect of X1 at the mean value of X2.”
I was following this regarding the value of b1 as the effect of X1 when X2=0 but I expected a caution that it is not a main effect because X2=0 is not the same as factor 2 being absent: it is when X2 is at the average value of its max and min. Also, you then say “X2=1 at the mean of the two categories of X2” but the mean of the categories is at X2=0, correct? Please help this confused math guy.
Hi Richard,
First, per your last point, yes it should say (and I just fixed it) “X2=0 at the mean of the two categories of X2.”
And it is a main effect. You’re right that X2 isn’t absent, but we are evaluating X1, averaging over all values of X2. This is a case where it’s important that the two values of X2 have equal sample sizes in order for 0 to be the mean of X2.
Does that help?
May I know how to interpret the INTERCEPT when you have two dummy coded variables – example – gender with females coded 0 and another IV with 4 categories (reference group coded 0) – would the intercept be the mean of females in the reference group? I am not getting that from my outputs. Many thanks!
Hi Ly,
Yes, that’s it exactly, as long as there are no other covariates in the model ( you don’t mention that).