Once you’ve imported your data into Stata the next step is usually examining it.
Before you work on building a model or running any tests, you need to understand your data. Ask yourself these questions:
- Is every variable marked as the appropriate type?
- Are missing observations coded consistently and marked as missing?
- Do I want to exclude any variables or data points?
Let’s answer these questions using Stata’s auto dataset.
If you don’t have the auto dataset loaded yet, type
sysuse auto, clear
Simple Commands to Look at Data in Stata
Before we look at the entire dataset, let’s look at two commands that provide a good summary of our data.
In the command line type and enter
describe
Describe will show you names, types, labels and more for all variables in your dataset, or for select ones if you enter their names.
Now type and enter
codebook, compact
The codebook command will show basic summary statistics for all variables in your dataset, or for select ones you choose.
Stata’s Browse Command
Now let’s see what options we have to look at the data directly. Type
help browse
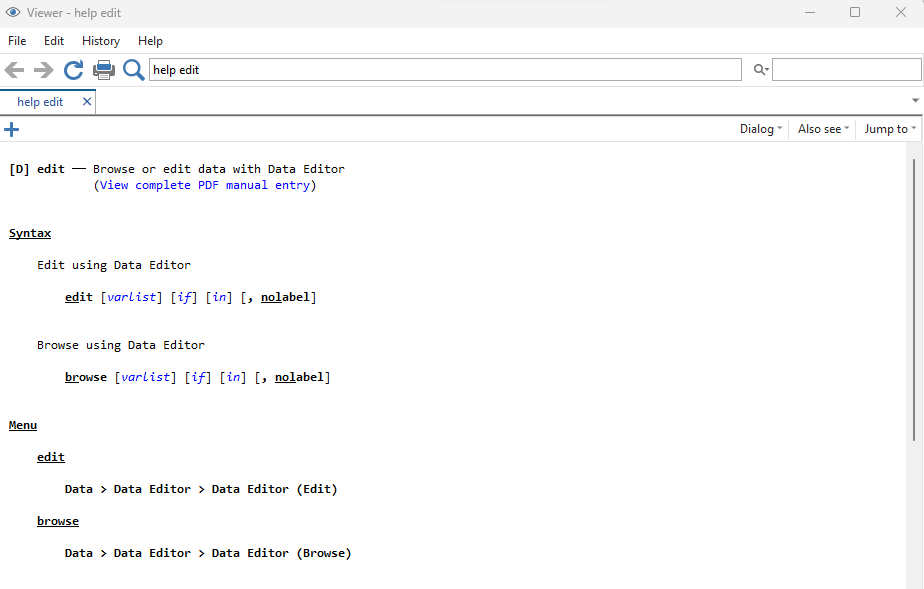
We see the help page for both the edit and browse commands.
If you need a refresher on what the syntax page is telling us, check out this blog post on Stata syntax.
In the Command Window, simply type the word “browse” and press enter.
Alternatively, you could select the Data Editor (Browse) icon on the top bar.

For the auto data, you should now see this screen.
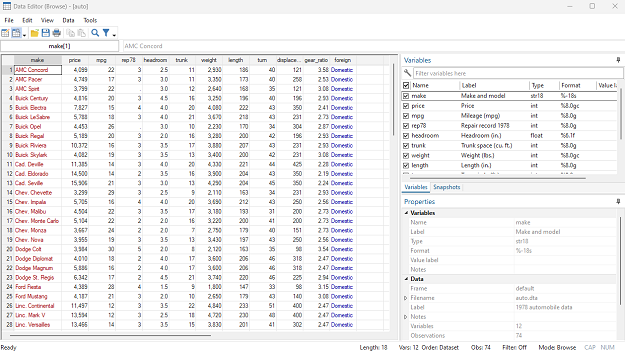
The Variables and Properties Windows are still present, but the rest of the screen was replaced by a spreadsheet of the data.
Note the difference in colors for different data types:
- Strings are displayed in red
- Numeric data (int, byte, float, long, double) are displayed in black
- Labelled factors are displayed in blue
Wait a minute. What is a labelled factor?
In this dataset, the variable “foreign” is a factor.
This means that the actual data type is numeric, but that each distinct number is associated with some word, and this is what we see when we look at the data.
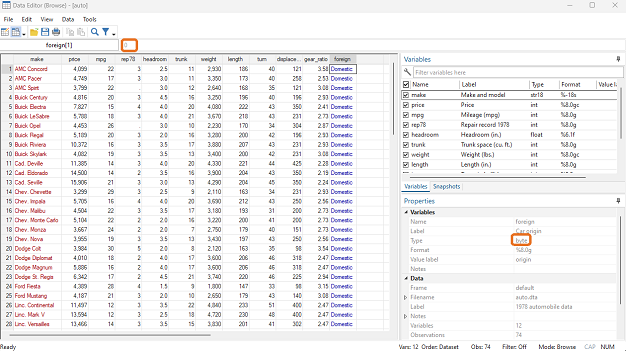
If you click on a data point of “foreign”, you should see a number appear in the small window at the top. This is telling us that each time “Domestic” is used as an observation, Stata is storing it as a 0.
In the Properties Window we can see that this variable is being stored as a byte.
We can change the labels to show numbers instead if we type:
browse, nolabel
Selecting Which Variables We Want to See
On the right side of the Data Editor (Browse) page, we can select which variables we want to see by using the check marks.
In the picture below, I deselected all variables except make, price, mpg, and foreign.
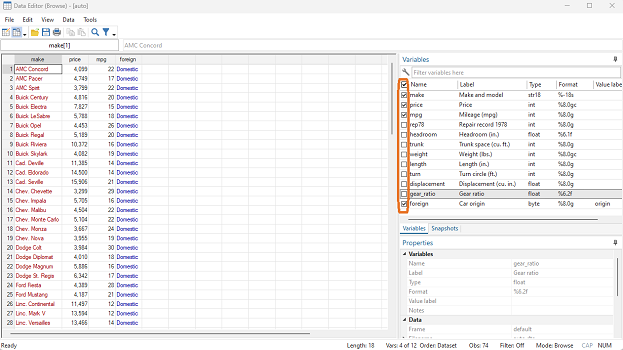
If we wanted to examine the same variables but using syntax, we could type
browse make price mpg foreign
Selecting Which Observations We Want to See
Now we want to go back to seeing all variables, but don’t want to see all observations for each variable.
Recheck all the variables, then click the filter icon at the top.
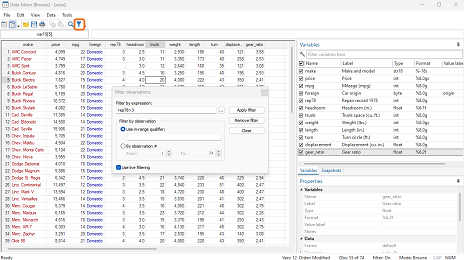
If you already knew which data points you want to see, you could choose to “Filter by observation” and select observation numbers.
Instead we will use the option to “Filter by expression”. Let’s look only at observations which have a repair record greater than 3.
Put in the expression rep78>3 and click “Apply filter”. For more complicated expressions, you could be aided by the three dots to the right of this box.
After doing this, the observations kept their original numbers. So while we still have an observation labeled number 74, we no longer have all 74 observations visible.
Missing Values
If you look at the rep78 column you’ll notice that we asked for only observations with a value greater than 3, but all the missing values stayed.
This is because Stata stores missing values for numeric variables as very high values.
When we ask for all observations higher than 3, Stata considers missing values to be among those that it should show.
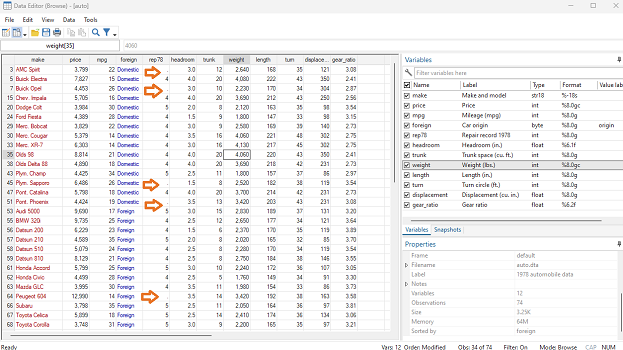
If we want to keep only the observations with rep78 greater than 3, while also hiding missing observations, we need to change our filter.
Click on the filter icon again; the “Filter by expression” can now say
rep78>3 & rep78!=.
We are now asking Stata to only show observations that have rep78 greater than 3 AND have a value for rep78 that is non-missing
If we wanted to get this all in syntax, we could type
browse if rep78>3 & rep78!=.
While the missing values in this data set were coded well, that will not always be the case. When examining your own data for missingness, look for strange values.
Are there a bunch of 99’s in a dataset that has most values around 10? Those are probably missing data, and you should recode them as such.
With that done, you should feel comfortable browsing your dataset in Stata using either menus or syntax. In the next post we’ll discuss editing our dataset in Stata.
by James Harrod
About the Author: James Harrod interned at The Analysis Factor in the summer of 2023. He plans to continue into a career as an actuary, and hopes to continue finding interesting ways of educating people about statistics. James is well-versed in R and Stata programming and enjoys teaching the intuition behind common statistical methods. James is a 2023 graduate of the University of Rochester with bachelor’s degrees in Statistics and Economics.


Leave a Reply