Standard deviation and standard error are statistical concepts you probably learned well enough in Intro Stats to pass the test. Conceptually, you understand them, yet the difference doesn’t make a whole lot of intuitive sense.
So in this article, let’s explore the difference between the two. We will look at an example, in the hopes of making these concepts more intuitive. You’ll also see why sample size has a big effect on standard error.
Standard Deviation
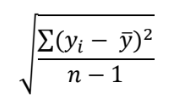
Standard deviation is a measure of variability of a random variable, Y.
It’s directly measured in a sample with this formula:

I emphasize “directly measured” because we’re actually using the sample values yi, in that formula.
A few key points in this formula are that we need n values of y, and we need a sample mean of those values, ![]() . This becomes important when we look at standard error.
. This becomes important when we look at standard error.
Standard Error
Standard error is also a standard deviation. But it’s not the standard deviation of a variable Y that we measure. It’s the standard deviation of a sample statistic of Y, like the sample mean, proportion, or regression coefficient.
This is where it gets unintuitive, a bit more abstract. It’s strange to think about a statistic having a standard deviation if we measured it only once.
After all, we already established that to calculate the standard deviation of a random variable, we need multiple values of that variable and an estimate of its mean. When it comes to a sample statistic, we have just one value. Just one measurement of the statistic of interest. One sample mean or one sample proportion.
So how could we possibly measure the variability of one value? (I can hear you asking).
Well, standard errors are a reflection of something we know: that if we were to collect another sample, the statistic from that second sample would be different than the statistic from our first sample. Similar, but not identical. We have variability.
If you want to see this in action, do a simple experiment. Roll a die 10 times and measure the proportion of times you rolled a one. That’s one sample proportion. Now do it again. Maybe a third time. You’ll get slightly different values for the proportion of ones in each sample.
This is how we know that sample statistics themselves are random variables. They have their own distribution of values each time we measure them.
But in real research we don’t do this. We usually collect a sample only once. In the case of standard error, we estimate the standard deviation of the statistic as if we had many samples.
Why is this Important?
The idea is to measure how well any given sample statistic is likely to reflect the actual population parameter. If the standard error is large, then that one sample statistic has a wide range of possible values across different samples. This leads to a wide confidence interval for that sample statistic. If the standard error is small, then any given sample statistic can’t be very far from the population parameter (narrow confidence interval).
To summarize: the bigger your sample, the smaller your standard error, and the narrower your confidence interval.
An Example
I find the best way to understand this is by taking an example to the extremes. Say your population has only 1000 individuals in it. Maybe it’s the entire population of a species of frog on a remote island.
Let’s say you want to measure the proportion of those frogs who have a specific genetic mutation and in actuality, 80 individuals have it. So the true population proportion is .08 = 80/1000.
You, of course, don’t know this. You haven’t measured the whole population.
Standard Error of a Small Sample
If you randomly sample 5 individuals from that species, and measure the proportion with the genetic mutation, that sample proportion could be anywhere in the range of 0 to 1. You could have sampled five frogs who had the mutation or all five who didn’t.
The sample proportion has a wide range of values because there are many, many samples with only 5 observations.
So when you get a sample proportion of .8 or 1 or 0, you understand it’s your best measure. But you also know you could get a very different sample proportion if you were to sample again (or someone else replicates your study).
But if you sample 995 individuals, you’ve got almost the whole population in your sample. The sample proportion can’t vary much. You’ve sampled all but 5 individuals.
At its lowest, you could have 75/995 with the mutation. You happened to randomly miss 5 with the mutation. At most you could have 80/995 (you happened to randomly miss 5 without the mutation. Your entire range of possible sample proportions is .075 to .080, no matter what.
So even though you’ve only selected one sample, the sample proportion must be in this very small range. Because your sample is so big, the standard error of the sample proportion is small.
Where standard errors come from
Estimates of standard errors are not directly calculated from sample data in the same way standard deviations are. Again, that’s because we have only one value of the sample statistic.
Most of the time, we base it on a theoretical formula of what it should be, based on this one sample statistic.
For example, the theoretical standard error of a sample proportion, p , is:

Like most standard error formulas, it has the sample size in the denominator. The larger the sample, the smaller the standard error of that statistic.


Leave a Reply