One of the nice features of SPSS is its ability to keep track of information on the variables themselves.
This includes variable labels, missing data codes, value labels, and variable formats. Spending the time to set up variable information makes data analysis much easier–you don’t have to keep looking up whether males are coded 1 or 0, for example.
And having them all in the variable view window makes things incredibly easy while you’re doing your analysis. But sometimes you need to just print them all out–to create a code book for another analyst or to include in the output you’re sending to a collaborator. Or even just to print them out for yourself for easy reference.
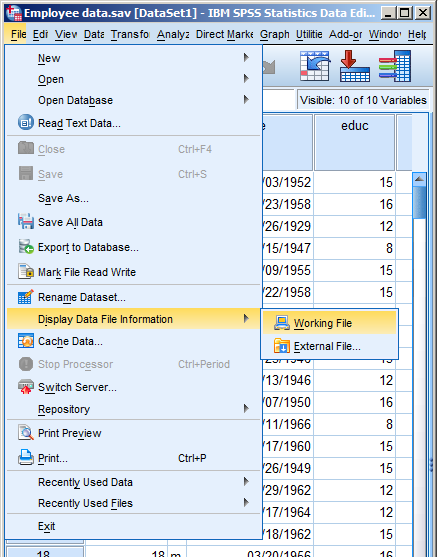
There is a nice little way to get a few tables with a list of all the variable metadata. It’s in the File menu. Simply choose Display Data File Information and Working File.
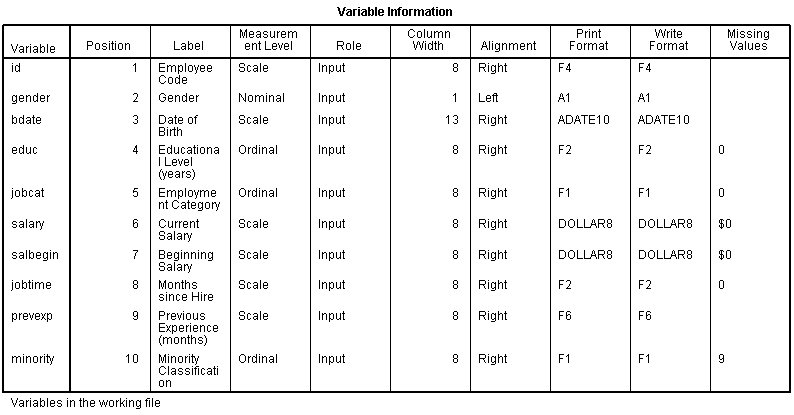
Doing this gives you two tables. The first includes the following information on the variables. I find the information I use the most are the labels and the missing data codes.
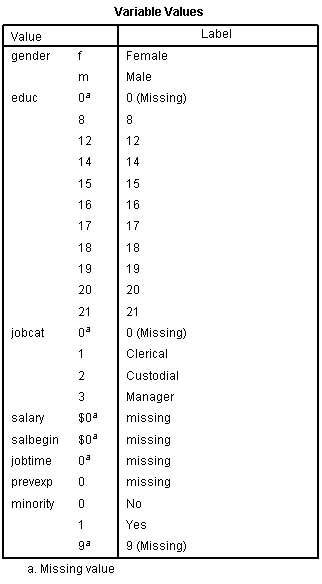
Even more useful, though, is the Value Label table.
It lists out the labels for all the values for each variable.
So you don’t have to remember that Job Category (jobcat) 1 is “Clerical,” 2 is “Custodial,” and 3 is “Managerial.”
It’s all right there.


Salam everyone.
i wanna know that, can i extract spss output result through any other programming language like R or python.
i wanna say that, i generate the frequency diagram in spss, now this table or image file in spss output that contains the data about frequency distribution, can i excess through R or python and import it to any other places except word, excel,power-point or pdf.
i am very thankful to you for your time that you’ll given to response this query.
i need ur assistance.Pls help me. For example a created a column:
Name and surname
1.hans watergate
2.peter edison
3.hans watergate
4.peter edison
i want to choose unique values, how can i do spss automatically select 1 and 2 and unselect 3 and 4 (because of repeated values)
Hi Karen,
is it possible to partition the table variable values for every variable? I need one table for every variable.
Thanks
Stefan
Hmm, without editing? Not that I know of. If it’s anywhere, I would look it up in the Command Syntax Reference. Often there are options in syntax that are not available in the menus.
I did not know this (is this a new feature of SPSS?).
It’s sweet.
Not new, it’s just hidden away.
Hi Karen,
I would love to see a workshop like this Intro to Data Analysis, but for R. Is there any possibility?
Sandy
Hi Sandy!
Indeed there is. It’s already in the works–we’re just working on the dates. Also one on running linear models in R.
Karen