ROC Curves are incredibly useful in evaluating any model or process that predicts group membership of individuals.
ROC stands for Receiver Operating Characteristic. This strange name goes back to its original use of assessing the accuracy of sonar readings. Any ROC can tell you how well a process or model distinguishes between true and false positives and negatives.
In this webinar, we’ll talk about what ROC Curves do, when they’re useful, and how to interpret the curve and some related statistics.
Note: This training is an exclusive benefit to members of the Statistically Speaking Membership Program and part of the Stat’s Amore Trainings Series. Each Stat’s Amore Training is approximately 90 minutes long.
About the Instructor

Karen Grace-Martin helps statistics practitioners gain an intuitive understanding of how statistics is applied to real data in research studies.
She has guided and trained researchers through their statistical analysis for over 15 years as a statistical consultant at Cornell University and through The Analysis Factor. She has master’s degrees in both applied statistics and social psychology and is an expert in SPSS and SAS.
Not a Member Yet?
It’s never too early to set yourself up for successful analysis with support and training from expert statisticians.
Just head over and sign up for Statistically Speaking.
You'll get access to this training webinar, 130+ other stats trainings, a pathway to work through the trainings that you need — plus the expert guidance you need to build statistical skill with live Q&A sessions and an ask-a-mentor forum.
I love working with my clients.
I love working with my clients for many reasons, but one of them is I learn so much from them.
Just this week, one of my clients showed me how to get SPSS GENLINMIXED results without the Model Viewer.
She’s my new hero.
If you’ve ever used GENLINMIXED, the procedure for Generalized Linear Mixed Models, you know that the results automatically appear in this new Model Viewer. (more…)
In our last article, we learned about model fit in Generalized Linear Models on binary data using the glm() command. We continue with the same glm on the mtcars data set (regressing the vs variable on the weight and engine displacement).
Now we want to plot our model, along with the observed data.
Although we ran a model with multiple predictors, it can help interpretation to plot the predicted probability that vs=1 against each predictor separately. So first we fit a glm for only (more…)
In the last article, we saw how to create a simple Generalized Linear Model on binary data using the glm() command. We continue with the same glm on the mtcars data set (more…)
Ordinary Least Squares regression provides linear models of continuous variables. However, much data of interest to statisticians and researchers are not continuous and so other methods must be used to create useful predictive models.
The glm() command is designed to perform generalized linear models (regressions) on binary outcome data, count data, probability data, proportion data and many other data types.
In this blog post, we explore the use of R’s glm() command on one such data type. Let’s take a look at a simple example where we model binary data.
(more…)
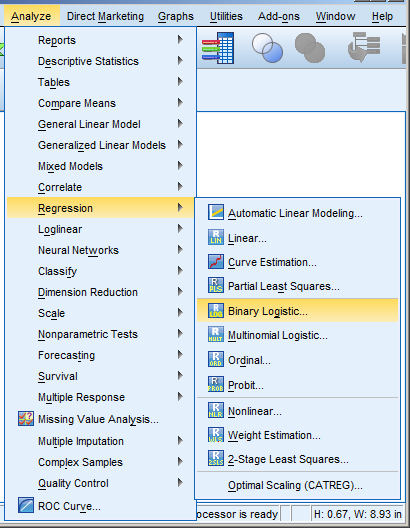
Need to run a logistic regression in SPSS? Turns out, SPSS has a number of procedures for running different types of logistic regression.
Some types of logistic regression can be run in more than one procedure. For some unknown reason, some procedures produce output others don’t. So it’s helpful to be able to use more than one.
Logistic Regression
 Logistic Regression can be used only for binary dependent (more…)


