Transformations don’t always help, but when they do, they can improve your linear regression model in several ways simultaneously.
They can help you better meet the linear regression assumptions of normality and homoscedascity (i.e., equal variances). They also can help avoid some of the artifacts caused by boundary limits in your dependent variable — and sometimes even remove a difficult-to-interpret interaction.
(more…)
Imagine this scenario:
This year’s flu strain is very vigorous. The number of people checking in at hospitals is rapidly increasing. Hospitals are desperate to know if they have enough beds to handle those who need their help.
You have been asked to analyze a previous year’s hospitalization length of stay by people with the flu who had been admitted to the hospital. The predictors in your data set are age group, gender and race of those admitted. You also have an indicator that signifies whether the hospital was privately or publicly run.
(more…)
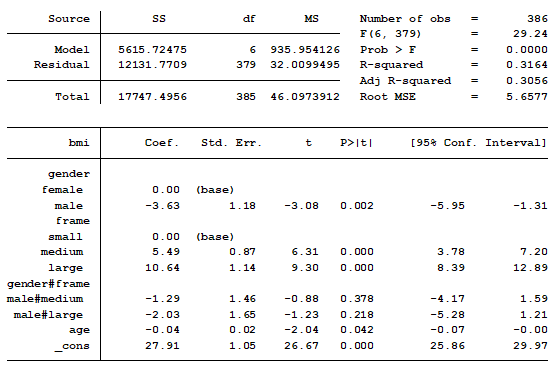
In a previous post we discussed using marginal means to explain an interaction to a non-statistical audience. The output from a linear regression model can be a bit confusing. This is the model that was shown.

In this model, BMI is the outcome variable and there are three predictors:
(more…)
Sometimes what is most tricky about understanding your regression output is knowing exactly what your software is presenting to you.
Here’s a great example of what looks like two completely different model results from SPSS and Stata that in reality, agree.
The Model
I ran a linear model regressing “physical composite score” on education and “mental composite score”.
The outcome variable, physical composite score, is a measurement of one’s physical well-being. The predictor “education” is categorical with four categories. The other predictor, mental composite score, is continuous and measures one’s mental well-being.
I am interested in determining whether the association between physical composite score and mental composite score is different among the four levels of education. To determine this I included an interaction between mental composite score and education.
The SPSS Regression Output
Here is the result of the regression using SPSS:
(more…)
In your typical statistical work, chances are you have already used quantiles such as the median, 25th or 75th percentiles as descriptive statistics.
But did you know quantiles are also valuable in regression, where they can answer a broader set of research questions than standard linear regression?
In standard linear regression, the focus is on estimating the mean of a response variable given a set of predictor variables.
In quantile regression, we can go beyond the mean of the response variable. Instead we can understand how predictor variables predict (1) the entire distribution of the response variable or (2) one or more relevant features (e.g., center, spread, shape) of this distribution.
For example, quantile regression can help us understand not only how age predicts the mean or median income, but also how age predicts the 75th or 25th percentile of the income distribution.
Or we can see how the inter-quartile range — the width between the 75th and 25th percentile — is affected by age. Perhaps the range becomes wider as age increases, signaling that an increase in age is associated with an increase in income variability.
In this webinar, we will help you become familiar with the power and versatility of quantile regression by discussing topics such as:
- Quantiles – a brief review of their computation, interpretation and uses;
- Distinction between conditional and unconditional quantiles;
- Formulation and estimation of conditional quantile regression models;
- Interpretation of results produced by conditional quantile regression models;
- Graphical displays for visualizing the results of conditional quantile regression models;
- Inference and prediction for conditional quantile regression models;
- Software options for fitting quantile regression models.
Join us on this webinar to understand how quantile regression can be used to expand the scope of research questions you can address with your data.
Note: This training is an exclusive benefit to members of the Statistically Speaking Membership Program and part of the Stat’s Amore Trainings Series. Each Stat’s Amore Training is approximately 90 minutes long.
(more…)
Most analysts’ primary focus is to check the distributional assumptions with regards to residuals. They must be independent and identically distributed (i.i.d.) with a mean of zero and constant variance.
Residuals can also give us insight into the quality of our models.
In this webinar, we’ll review and compare what residuals are in linear regression, ANOVA, and generalized linear models. Jeff will cover:
- Which residuals — standardized, studentized, Pearson, deviance, etc. — we use and why
- How to determine if distributional assumptions have been met
- How to use graphs to discover issues like non-linearity, omitted variables, and heteroskedasticity
Knowing how to piece this information together will improve your statistical modeling skills.
Note: This training is an exclusive benefit to members of the Statistically Speaking Membership Program and part of the Stat’s Amore Trainings Series. Each Stat’s Amore Training is approximately 90 minutes long.
(more…)


