
Multicollinearity is one of those terms in statistics that is often defined in one of two ways:
1. Very mathematical terms that make no sense — I mean, what is a linear combination anyway?
2. Completely oversimplified in order to avoid the mathematical terms — it’s a high correlation, right?
So what is it really? In English?
(more…)
Survey questions are often structured without regard for ease of use within a statistical model.
Take for example a survey done by the Centers for Disease Control (CDC) regarding child births in the U.S. One of the variables in the data set is “interval since last pregnancy”. Here is a histogram of the results.
(more…)
At times it is necessary to convert a continuous predictor into a categorical predictor. For example, income per household is shown below.
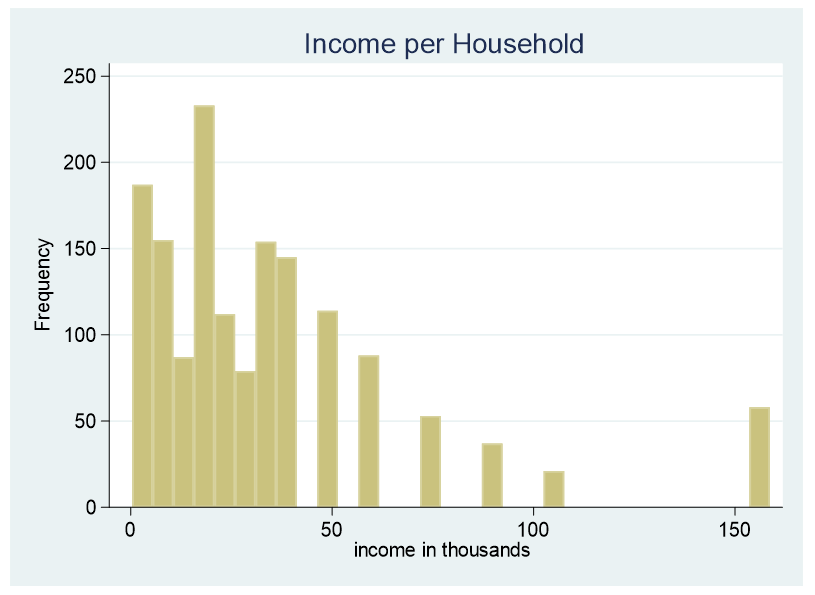
This data is censored, all family income above $155,000 is stated as $155,000. A further explanation about censored and truncated data can be found here. It would be incorrect to use this variable as a continuous predictor due to its censoring.
(more…)
What’s a good method for interpreting the results of a model with two continuous predictors and their interaction?
Let’s start by looking at a model without an interaction. In the model below, we regress a subject’s hip size on their weight and height. Height and weight are centered at their means.
(more…)
One approach to model building is to use all predictors that make theoretical sense in the first model. For example, a first model for determining birth weight could include mother’s age, education, marital status, race, weight gain during pregnancy and gestation period.
The main effects of this model show that a mother’s education level and marital status are insignificant.
(more…)
In a recent article, we reviewed the impact of removing the intercept from a regression model when the predictor variable is categorical. This month we’re going to talk about removing the intercept when the predictor variable is continuous.
Spoiler alert: You should never remove the intercept when a predictor variable is continuous.
Here’s why. (more…)