In the last article, we saw how to create a simple Generalized Linear Model on binary data using the glm() command. We continue with the same glm on the mtcars data set (more…)
OptinMon 02 - Binary, Ordinal, and Multinomial Logistic Regression...
Generalized Linear Models in R, Part 2: Understanding Model Fit in Logistic Regression Output
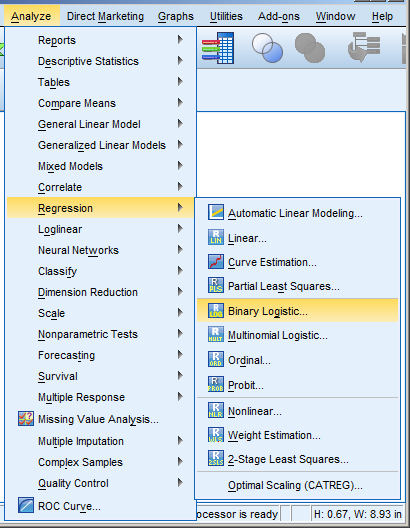
SPSS Procedures for Logistic Regression
Need to run a logistic regression in SPSS? Turns out, SPSS has a number of procedures for running different types of logistic regression.
Some types of logistic regression can be run in more than one procedure. For some unknown reason, some procedures produce output others don’t. So it’s helpful to be able to use more than one.
Logistic Regression
 Logistic Regression can be used only for binary dependent (more…)
Opposite Results in Ordinal Logistic Regression, Part 2
I received the following email from a reader after sending out the last article: Opposite Results in Ordinal Logistic Regression—Solving a Statistical Mystery.
And I agreed I’d answer it here in case anyone else was confused.
Karen’s explanations always make the bulb light up in my brain, but not this time.
With either output,
The odds of 1 vs > 1 is exp[-2.635] = 0.07 ie unlikely to be 1, much more likely (14.3x) to be >1
The odds of £2 vs > 2 exp[-0.812] =0.44 ie somewhat unlikely to be £2, more likely (2.3x) to be >2SAS – using the usual regression equation
If NAES increases by 1 these odds become (more…)
Opposite Results in Ordinal Logistic Regression—Solving a Statistical Mystery
A number of years ago when I was still working in the consulting office at Cornell, someone came in asking for help interpreting their ordinal logistic regression results.
The client was surprised because all the coefficients were backwards from what they expected, and they wanted to make sure they were interpreting them correctly.
It looked like the researcher had done everything correctly, but the results were definitely bizarre. They were using SPSS and the manual wasn’t clarifying anything for me, so I did the logical thing: I ran it in another software program. I wanted to make sure the problem was with interpretation, and not in some strange default or (more…)
Generalized Ordinal Logistic Regression for Ordered Response Variables
When the response variable for a regression model is categorical, linear models don’t work. Logistic regression is one type of model that does, and it’s relatively straightforward for binary responses.
When the response variable is not just categorical, but ordered categories, the model needs to be able to handle the multiple categories, and ideally, account for the ordering.
An easy-to-understand and common example is level of educational attainment. Depending on the population being studied, some response categories may include:
1 Less than high school
2 Some high school, but no degree
3 Attain GED
4 High school graduate
You can see how there are qualitative differences in these categories that wouldn’t be captured by years of education. You can also see that (more…)
Chi-square test vs. Logistic Regression: Is a fancier test better?
I recently received this email, which I thought was a great question, and one of wider interest…
Hello Karen,
I am an MPH student in biostatistics and I am curious about using regression for tests of associations in applied statistical analysis. Why is using regression, or logistic regression “better” than doing bivariate analysis such as Chi-square?I read a lot of studies in my graduate school studies, and it seems like half of the studies use Chi-Square to test for association between variables, and the other half, who just seem to be trying to be fancy, conduct some complicated regression-adjusted for-controlled by- model. But the end results seem to be the same. I have worked with some professionals that say simple is better, and that using Chi- Square is just fine, but I have worked with other professors that insist on building models. It also just seems so much more simple to do chi-square when you are doing primarily categorical analysis.
My professors don’t seem to be able to give me a simple justified
answer, so I thought I’d ask you. I enjoy reading your site and plan to begin participating in your webinars.Thank you!
