Once you’ve imported your data into Stata the next step is usually examining it.
Before you work on building a model or running any tests, you need to understand your data. Ask yourself these questions:
- Is every variable marked as the appropriate type?
- Are missing observations coded consistently and marked as missing?
- Do I want to exclude any variables or data points?
(more…)
SPSS has a nice little feature for adding and averaging variables with  missing data that many people don’t know about.
It allows you to add or average variables that have some missing data, while specifying how many are allowed to be missing. (more…)
In our previous posts, we’ve relied on Stata’s pre-loaded datasets to perform analyses. But when you’re working with your own data, you’ll need to know how to import it into Stata.
To demonstrate how this process works, we will use the Iris dataset from UCI.
Download the dataset, then move it to whichever directory you intend to use for Stata files.
There are three main ways of importing data in Stata: either use the menus to import the data, call the dataset by its full file extension, or change your directory to the one with your data and then refer to the dataset by name. (more…)
You might be surprised to hear that not only can linear regression fit lines between a response variable Y and one or more predictor variables, X, it can fit curves too. There are many ways to do this, but the simplest is by adding a polynomial term.
So what is a polynomial term and how do you know you need one?
The linear parameters in a regression model
A linear regression model has a few key parameters. These include the intercept coefficient, the slope coefficient, and the residual variance.
That intercept defines the height of the regression line. It does so by measuring the height of the line at one specific point: when all X = 0.
The slope defines how much Y differs, on average, for each one unit difference in X. In other words, it measures the constant relationship between X and Y. Yes, there can be multiple Xs and each one has its own slope.
A polynomial term–a quadratic (squared) or cubic (cubed) term turns a linear regression model into a curve.
(more…)
Have you ever wondered whether you should report separate means for different groups or a pooled mean from the entire sample? This is a common scenario that comes up, for instance in deciding whether to separate by sex, region, observed treatment, et cetera.
(more…)
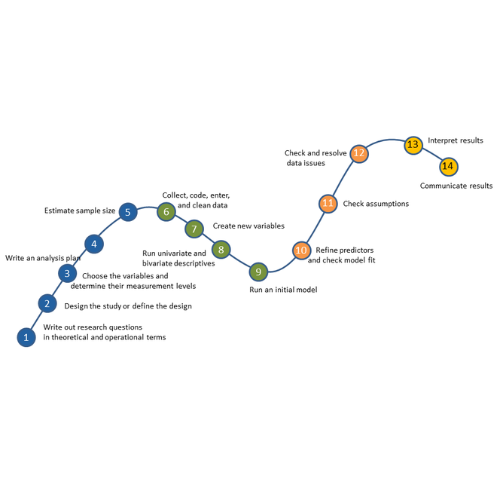
No matter what statistical model you’re running, you need to go through the same steps. The order and the specifics of  how you do each step will differ depending on the data and the type of model you use.
These steps are in 4 phases. Most people think of only the third as modeling. But the phases before this one are fundamental to making the modeling go well. It will be much, much easier, more accurate, and more efficient if you don’t skip them.
And there is no point in running the model if you skip phase 4.
If you think of them all as part of the analysis, the modeling process will be faster, easier, and make more sense.
Phase 1: Define and Design
In the first 5 steps of running the model, the object is clarity. You want to make everything as clear as possible to yourself. The more clear things are at this point, the smoother everything will be. (more…)


