by Maike Rahn, PhD
One of the hardest things to determine when conducting a factor analysis is how many factors to settle on. Statistical programs provide a number of criteria to help with the selection.
Eigenvalue > 1
Programs usually have a default cut-off for the number of generated factors, such as all factors with an eigenvalue of ≥1.
This is because a factor with an eigenvalue of 1 accounts for as much variance as a single variable, and the logic is that only factors that explain at least the same amount of variance as a single variable is worth keeping.
But often a cut-off of 1 results in more factors than the user bargained for or (more…)
by Maike Rahn, PhD
An important question that the consultants at The Analysis Factor are frequently asked is:
What is the difference between a confirmatory and an exploratory factor analysis?
A confirmatory factor analysis assumes that you enter the factor analysis with a firm idea about the number of factors you will encounter, and about which variables will most likely load onto each factor.
Your expectations are usually based on published findings of a factor analysis.
An example is a fatigue scale that has previously been validated. You would like to make sure that the variables in your sample load onto the factors the same way they did in the original research.
In other words, you have very clear expectations about what you will find in your own sample. This means that (more…)
by Maike Rahn, PhD
Rotations
An important feature of factor analysis is that the axes of the factors can be rotated within the multidimensional variable space. What does that mean?
Here is, in simple terms, what a factor analysis program does while determining the best fit between the variables and the latent factors: (more…)
Why use factor analysis?
Factor analysis is a useful tool for investigating variable relationships for complex concepts such as socioeconomic status, dietary patterns, or  psychological scales.
It allows researchers to investigate concepts they cannot measure directly. It does this by using a large number of variables to esimate a few interpretable underlying factors.
What is a factor?
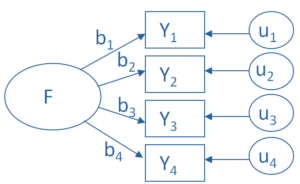
The key concept of factor analysis is that multiple observed variables have similar patterns of responses because they are all associated with a latent variable (i.e. not directly measured). (more…)
Before you run a Cronbach’s alpha or factor analysis on scale items, it’s generally a good idea to reverse code items that are negatively worded so that a high value indicates the same type of response on every item.
So for example let’s say you have 20 items each on a 1 to 7 scale. For most items, a 7 may indicate a positive attitude toward some issue, but for a few items, a 1 indicates a positive attitude.
I want to show you a very quick and easy way to reverse code them using a single command line. This works in any software. (more…)
Factor is confusing much in the same way as hierarchical and beta, because it too has different meanings in different contexts. Factor might be a little worse, though, because its meanings are related.
In both meanings, a factor is a variable. But a factor has a completely different meaning and implications for use in two different contexts. (more…)

