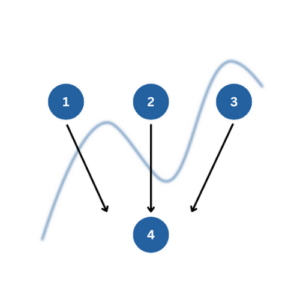
 When you put a continuous predictor into a linear regression model, you assume it has a constant relationship with the dependent variable along the predictor’s range. But how can you be certain? What is the best way to measure this?
And most important, what should you do if it clearly isn’t the case?
Let’s explore a few options for capturing a non-linear relationship between X and Y within a linear regression (yes, really). (more…)
We’ve talked a lot around here about the reasons to use syntax — not only menus — in your statistical analyses.
Regardless of which software you use, the syntax file is pretty much always a text file. This is true for R, SPSS, SAS, Stata — just about all of them.
This is important because it means you can use an unlikely tool to help you code: Microsoft Word.
I know what you’re thinking. Word? Really?
Yep, it’s true. Essentially it’s because Word has much better Search-and-Replace options than your stat software’s editor.
Here are a couple features of Word’s search-and-replace that I use to help me code faster:
(more…)
Not too long ago, a colleague mentioned that while he does a lot of study design these days, he no longer does much data analysis.
His main reason was that 80% of the work in data analysis is preparing the data for analysis. Data preparation is s-l-o-w and he found that few colleagues and clients understood this.
Consequently, he was running into expectations that he should analyze a raw data set in an hour or so.
You know, by clicking a few buttons.
I see this as well with researchers new to data analysis. While they know it will take longer than an hour, they still have unrealistic expectations about how long it takes.
So I am here to tell you, the time-consuming part is preparing the data. Weeks is a realistic time frame. Hours is not.
(Feel free to send this to your colleagues who want instant results.)
There are three parts to preparing data: cleaning it, creating necessary variables, and formatting all variables.
Data Cleaning
Data cleaning means finding and eliminating errors in the data. How you approach it depends on how large the data set is, but the kinds of things you’re looking for are:
- Impossible or otherwise incorrect values for specific variables
- Cases in the data who met exclusion criteria and shouldn’t be in the study
- Duplicate cases
- Missing data and outliers (don’t delete all outliers, but you may need to investigate to see if one is an error)
- Skip-pattern or logic breakdowns
- Making sure that the same value of string variables is always written the same way (male ≠ Male in most statistical software).
You can’t avoid data cleaning and it always takes a while, but there are ways to make it more efficient. For example, rather than search through the data set for impossible values, print a table of data values outside a normal range, along with subject ids.
This is where learning how to code in your statistical software of choice really helps. You’ll need to subset your data using IF statements to find those impossible values.
But if your data set is anything but small, you can also save yourself a lot of time, code, and errors by incorporating efficiencies like loops and macros so that you can perform some of these checks on many variables at once.
Creating New Variables
Once the data are free of errors, you need to set up the variables that will directly answer your research questions.
It’s a rare data set in which every variable you need is measured directly.
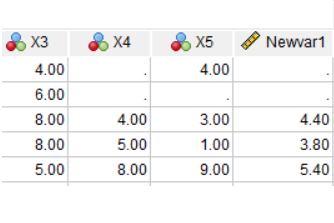
So you may need to do a lot of recoding and computing of variables.
Examples include:
And of course, part of creating each new variable is double-checking that it worked correctly.

Formatting Variables
Both original and newly created variables need to be formatted correctly for two reasons:
First, so your software works with them correctly. Failing to format a missing value code or a dummy variable correctly will have major consequences for your data analysis.
Second, it’s much faster to run the analyses and interpret results if you don’t have to keep looking up which variable Q156 is.
Examples include:
- Setting all missing data codes so missing data are treated as such
- Formatting date variables as dates, numerical variables as numbers, etc.
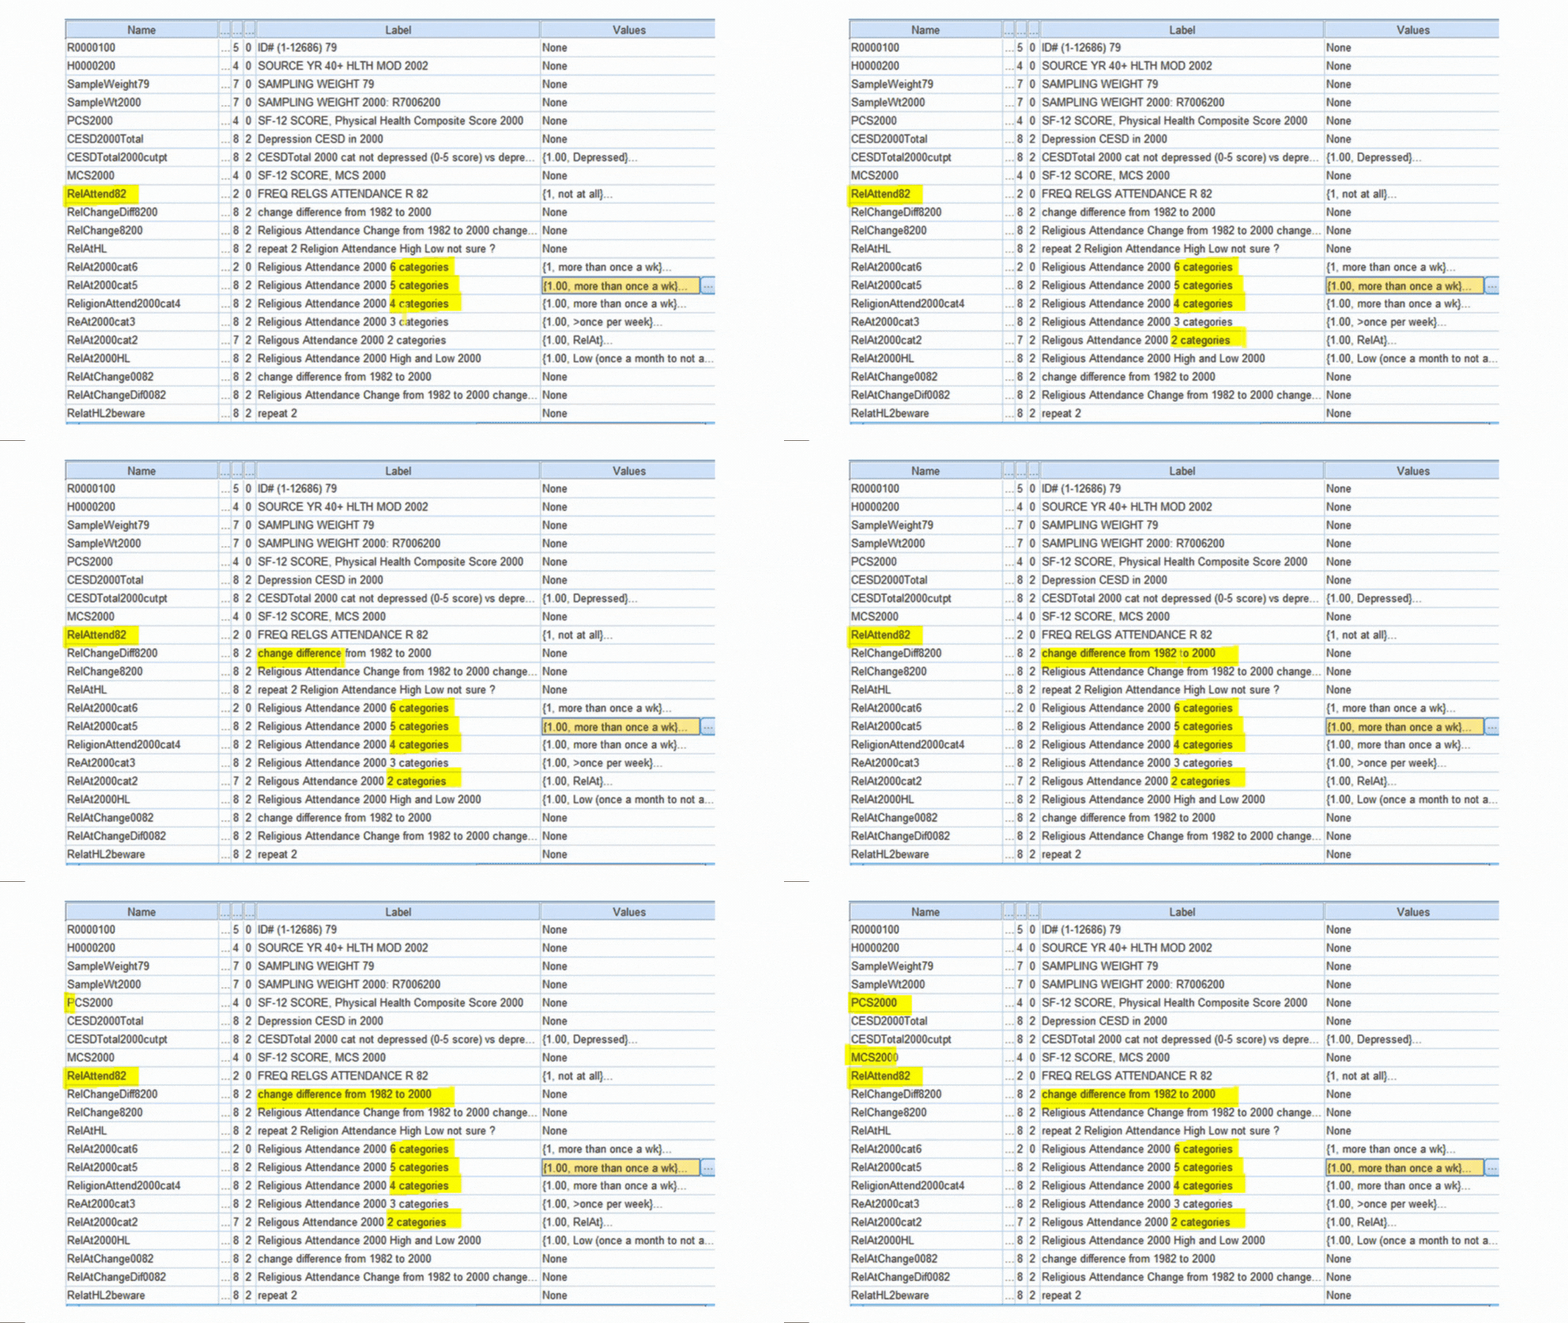
- Labeling all variables and categorical values so you don’t have to keep looking them up.
All of these steps require a solid knowledge of how to manage data in your statistical software. Each one approaches them a little differently.
It’s also very important to keep track of and be able to easily redo all your steps. Always assume you’ll have to redo something. So use (or record) syntax, not only menus.
Do I really need to learn R?
Someone asked me this recently.
Many R advocates would absolutely say yes to everyone who asks.
I don’t.
(I actually gave her a pretty long answer, summarized here).
It depends on what kind of work you do and the context in which you’re working.
I can say that R is (more…)
 In the world of data analysis, there’s not always one right statistical analysis for every research question.
There are so many issues to take into account. They include the research question to be answered, the measurement of the variables, the study design, data limitations and issues, the audience, practical constraints like software availability, and the purpose of the data analysis.
So what do you do when a reviewer rejects your choice of data analysis? And you believe it’s right? This reviewer can be your boss, your dissertation committee, a co-author, the PI, or the ubiquitous journal reviewer #2.
What do you do?
There are ultimately two choices: You can redo the analysis their way. Or you can fight for your analysis. How do you choose?
The one absolute in this choice is that you have to honor the integrity of your data analysis and yourself.
Good science matters.
Do not be persuaded to do an analysis that will produce inaccurate or misleading results. Especially when readers will actually make decisions based on these results.
On the other hand, If no one will ever read your report, this is less crucial.
But even within that absolute, there are often choices. Keep in mind the two goals in data analysis:
- The analysis needs to accurately reflect the limits of the design and the data, while still answering the research question. Assumptions have to be reasonably met.
- The analysis needs to communicate the results to the audience.
When to fight for your analysis
So first and foremost, if your reviewer is asking you to do an analysis that does not appropriately take into account the design or the variables, you need to fight.
For example, a number of years ago I worked with a researcher who had a study with repeated measurements on the same individuals. It had a small sample size and an unequal number of observations on each individual.
It was clear that to take into account the design and the unbalanced data, the appropriate analysis was a linear mixed model.
The researcher’s co-author questioned the use of the linear mixed model, mainly because he wasn’t familiar with it. He thought the researcher was attempting something fishy. His suggestion was to use an ad hoc technique of averaging over the multiple observations for each subject.
This was a situation where fighting was worth it.
Unnecessarily simplifying the analysis to please people who were unfamiliar with an appropriate method was not an option. The simpler model would have violated assumptions.
This was particularly important because the research was being submitted to a high-level journal.
So it was the researcher’s job to educate not only his coauthor, but the readers, in the form of explaining the analysis and its advantages, with citations, right in the paper.
When to jump through hoops
In contrast, sometimes the reviewer is not really asking for a completely different analysis. They just want a similar analysis that reports different specific statistics.
Let’s use another example with repeated measures data.
In this example, the client had a simple (2) pre-post by (3) treatment group design. Time was within subjects and treatment group was between subjects.
I’ve seen it happen many times that the committee or reviewer #2 is familiar with Repeated Measures ANOVA and wants to see the types of statistics that are easy to compute for ordinary least squares (OLS) statistical models.
Examples include a model R2 and effect size statistics like eta2.
This is a situation where it may be easier, and produces no ill-effects, to jump through the hoop.*
Running the analysis they prefer won’t violate any assumptions or produce inaccurate results. This assumes you have no missing data in the design and it’s reasonable to assume sphericity (both of which were true in this case).
If the reviewer can stop your research in its tracks, it may be worth it to rerun the analysis to get the statistics they want to see reported.
You do have to decide whether the cost of jumping through the hoop, in terms of time, money, and emotional energy, is worth it.
If the request is relatively minor, it usually is. If it’s a matter of rerunning every analysis you’ve done to indulge a committee member’s pickiness, it may be worth standing up for yourself and your analysis.
*A note on these examples: there are many other design issues that can make a repeated measures ANOVA not work and a fight worth it. You can read about them here.
How to Fight for your Analysis
When you’re dealing with anonymous reviewers, the situation can get sticky. After all, you cannot ask them to clarify their concerns. And you have limited opportunities to explain the reasons for choosing your analysis.
It may be harder to discern if they are being overly picky, don’t understand the statistics themselves, or have a valid point.
If you choose to stand up for yourself, be well armed. Research the issue until you are absolutely confident in your approach (or until you’re convinced that you were missing something).
A few hours in the library or talking with a trusted expert is never a wasted investment. Compare that to running an unpublishable analysis to please a committee member or coauthor.
Often, the problem is actually not about whether you did the right statistical analysis, but in the way you explained it. It’s your job to explain your analysis with enough detail and the correct wording. You’ll need to include why the analysis is appropriate and, if it’s unfamiliar to readers, what it does.
Rewrite that section, making it very clear. Ask someone to review it. Cite other research that uses or explains that statistical method.
Whatever you choose, be confident that you made the right decision, then move on.
 When you put a continuous predictor into a linear regression model, you assume it has a constant relationship with the dependent variable along the predictor’s range. But how can you be certain? What is the best way to measure this?


