Every statistical model and hypothesis test has assumptions.
And yes, if you’re going to use a statistical test, you need to check whether those assumptions are reasonable to whatever extent you can.
Some assumptions are easier to check than others. Some are so obviously reasonable that you don’t need to do much to check them most of the time. And some have no good way of being checked directly, so you have to use situational clues.
(more…)
When I was in graduate school, stat professors would say “ANOVA is just a special case of linear regression.” But they never explained why.
And I couldn’t figure it out.
The model notation is different.
The output looks different.
The vocabulary is different.
The focus of what we’re testing is completely different. How can they be the same model?
(more…)
Have you ever heard that “2 tall parents will have shorter children”?
This phenomenon, known as regression to the mean, has been used to explain everything from patterns in hereditary stature (as Galton first did in 1886) to why movie sequels or sophomore albums so often flop.
So just what is regression to the mean (RTM)? (more…)
Interpreting regression coefficients can be tricky, especially when the model has interactions or categorical predictors (or worse – both).
But there is a secret weapon that can help you make sense of your regression results: marginal means.
They’re not the same as descriptive stats. They aren’t usually included by default in our output. And they sometimes go by the name LS or Least-Square means.
And they’re your new best friend.
So what are these mysterious, helpful creatures?
What do they tell us, really? And how can we use them?
(more…)
 As mixed models are becoming more widespread, there is a lot of confusion about when to use these more flexible but complicated models and when to use the much simpler and easier-to-understand repeated measures ANOVA.
One thing that makes the decision harder is sometimes the results are exactly the same from the two models and sometimes the results are (more…)
In a previous post we discussed using marginal means to explain an interaction to a non-statistical audience. The output from a linear regression model can be a bit confusing. This is the model that was shown.
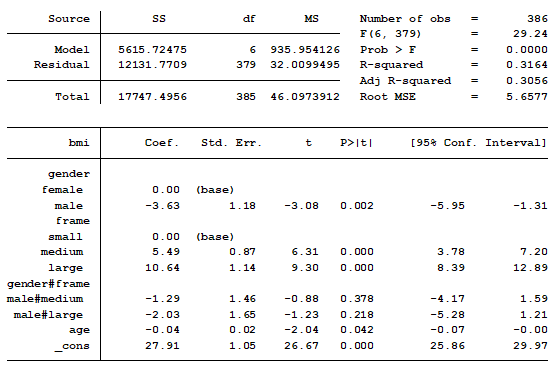
In this model, BMI is the outcome variable and there are three predictors:
(more…)