by Christos Giannoulis, PhD
Attributes are often measured using multiple variables with different upper and lower limits. For example, we may have five measures of political orientation, each with a different range of values.
Each variable is measured in a different way. The measures have a different number of categories and the low and high scores on each measure are different.
(more…)
Meta-analysis is the quantitative pooling of data from multiple studies. Meta-analysis done well has many strengths, including statistical power, precision in effect size estimates, and providing a summary of individual studies.
But not all meta-analyses are done well. The three threats to the validity of a meta-analytic finding are heterogeneity of study results, publication bias, and poor individual study quality.
(more…)
by Steve Simon, PhD
The Cox regression model has a fairly minimal set of assumptions, but how do you check those assumptions and what happens if those assumptions are not satisfied?
Non-proportional hazards
The proportional hazards assumption is so important to Cox regression that we often include it in the name (the Cox proportional hazards model). What it essentially means is that the ratio of the hazards for any two individuals is constant over time. They’re proportional. It involves logarithms and it’s a strange concept, so in this article, we’re going to show you how to tell if you don’t have it.
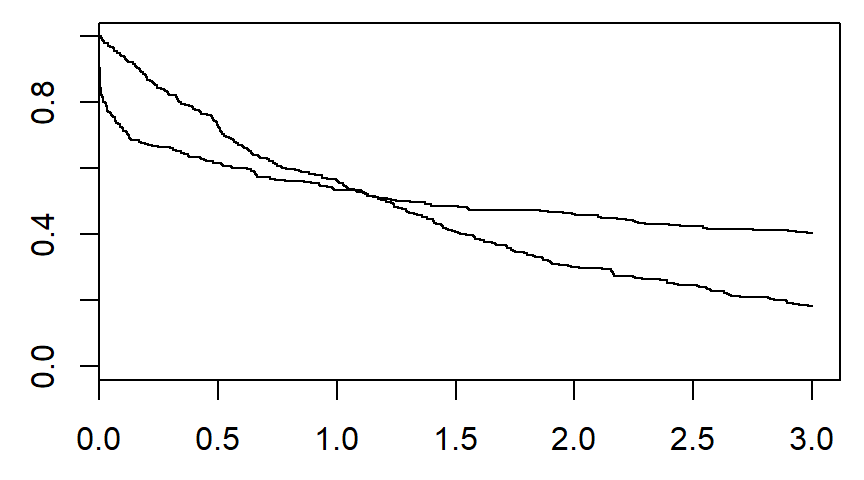
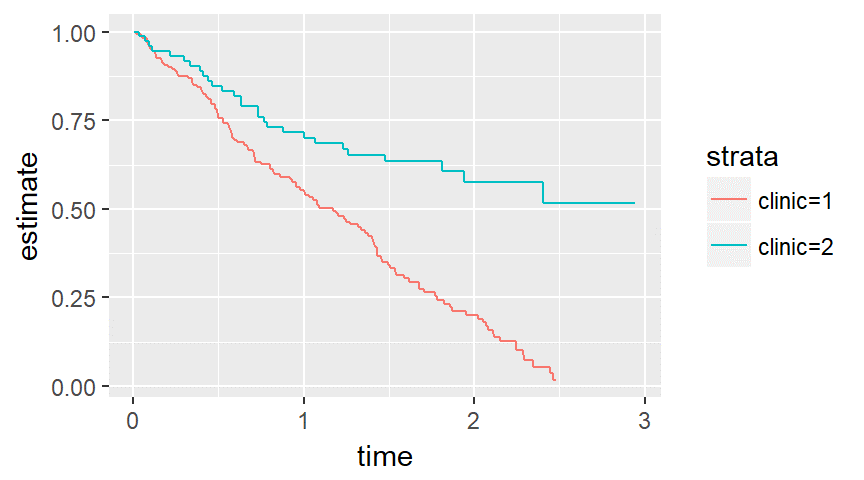
There are several graphical methods for spotting this violation, but the simplest is an examination of the Kaplan-Meier curves.
If the curves cross, as shown below, then you have a problem.
Likewise, if one curve levels off while the other drops to zero, you have a problem.
You can think of non-proportional hazards as an interaction of your independent variable with time. It means that you have to do more work in interpreting your model. If you ignore this problem, you may also experience a serious loss in power.
If you have evidence of non-proportional hazards, don’t despair. There are several fairly simple modifications to the Cox regression model that will work for you.
Nonlinear covariate relationships
The Cox model assumes that each variable makes a linear contribution to the model, but sometimes the relationship may be more complex.
You can diagnose this problem graphically using residual plots. The residual in a Cox regression model is not as simple to compute as the residual in linear regression, but you look for the same sort of pattern as in linear regression.
If you have a nonlinear relationship, you have several options that parallel your choices in a linear regression model.
Lack of independence
Lack of independence is not something that you have to wait to diagnose until your data is collected. Often it is something you are aware from the start because certain features of the design, such as centers in a multi-center study, are likely to produce correlated outcomes. These are the same issues that hound you with a linear regression model in a multi-center study.
There are several ways to account for lack of independence, but this is one problem you don’t want to ignore. An invalid model will ruin all your confidence intervals and p-values.
It was Casey Stengel who offered the sage advice, “If you come to a fork in the road, take it.”
When you need to fit a regression model to survival data, you have to take a fork in the road. One road asks you to make a distributional assumption about your data and the other does not. (more…)