A great way to get started with Stata is using its menus.
The first part of this Tutorial Series introduced you to Stata’s windows. You can now begin learning how to use Stata to work with data.
Across the top are 8 tabs: File, Edit, Data, Graphics, Statistics, User, Window, and Help.

We will not go through every option within the Stata menus. Instead, we’ll highlight a few options to get you started. In this article, we’ll start with three of the most useful menus: File, Data, and Help, along with those helpful icons under the menus.
In our next article, we’ll look at two more: Graphics and Statistics.
File

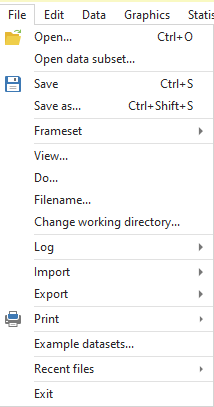
Within the file tab we can click Open to explore our directory and open a data set, do-file, Stata graph etc.
Click Save to save the current Stata session. If you save a Stata session, then close it and reopen the file, you will have any datasets you imported, with any changes to them.
You will, however, lose the history and results that were made in the session.
If you wanted to save the history of commands you entered, the Log option comes to the rescue.
Click Log -> Begin and then decide where you want to put the log and what to name it. This log will update with each command you run. When you’re done with your analysis and close Stata, you can open the log file and see a complete history of all the commands you entered and the output that was produced.
Import allows you to bring in your own data from any number of different formats.
Once you’ve made edits to your dataset, you can use Export to save the altered version of the dataset elsewhere.
Click on Example datasets, then click Example datasets installed with Stata, and import any from this list by clicking the use button.
Try clicking “use” for the cancer data. Stata will load up that dataset and put the syntax “sysuse cancer.dta” into the results window.
We can see that working with the menus in Stata provides a great way to figure out command syntax. You can find what you’re looking for the first time through the menus, then use the command line if you want to run a given command again.
Data

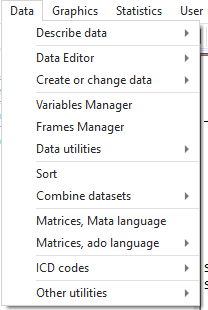
Using the data tab, click on Describe Data to view summary statistics, variable names and labels for some or all variables in the dataset.
Under Data Editor browse or edit your data.
By clicking Create or Change Data, create new variables in the dataset or change the ones that are already there.
With Data Utilities, make more basic changes like switching names and check information such as the number of observations less than a particular value.
Combine Datasets is very useful when merging or appending data. You must be certain that the datasets are appropriately matched up.
Help

We have an excellent webinar by Jeff Meyer that gives a general overview of getting help in Stata, but we will go over the basics of getting help in the menus here as well.
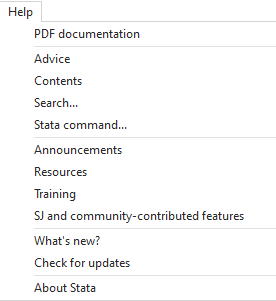
Under Advice is a short list that explains the basics of getting help in Stata. Take a minute to read this right now.
To get help through the menus, the best option most of the time is to click on Search, enter whichever topic you need help with, and then scroll through the available materials until you find what you’re looking for.
Go to Help -> Search…, then enter the term “regress”. Look at some of the articles that come up.
If you know exactly which command to use and just need the details of its formatting, you can click on Stata command, enter the command name, and go straight to the proper help page.
Go to Help -> Stata command…, then enter the term “regress”. Look at the specific help page for this command.
Icons

Under the menus lie a few icons (all these options can also be found in the menus). Use Icons to quickly open or save files, print, log, make new do files, browse or edit data, and more. Hover over each icon to see what it’s called and think of when you might use them.
That was a lot! You should now be comfortable navigating the menus of Stata and using them to do some basic data manipulation.
by James Harrod
About the Author: James Harrod interned at The Analysis Factor in the summer of 2023. He plans to continue into a career as an actuary, and hopes to continue finding interesting ways of educating people about statistics. James is well-versed in R and Stata programming and enjoys teaching the intuition behind common statistical methods. James is a 2023 graduate of the University of Rochester with bachelor’s degrees in Statistics and Economics.


Leave a Reply