
A Note From Karen
As always, we have great stuff going on this month.
First, we are currently working on a major upgrade to
the backend of our web site and email systems. You'll notice this
most if you're a consulting client or a member in one of our programs,
but should soon see that our sites are easier to use and
navigate. We're also planning a front-end redesign, and visible
changes should occur in the next month or so.
Over the next few months, we are going to have a few great guest instructors in our Data Analysis Brown Bag
program on some often-requested topics. This month we'll welcome
Steve Simon from Pmean Consulting, who will give us an introduction to Bayesian data analysis.
Many of us received little to no training in Bayesian stats, but they
are useful in many situations. Join us to learn what they are and
how they're used.
We are just finishing up a couple workshops and have a
few others coming up in late summer and fall. But next week is
one of my favorites: Logistic Regression.
It is the first workshop I put together years ago, and it has since
been rewritten and expanded many times over. It's still one of my
most popular workshops. If this is a topic you've been wanting to
learn, sign up now--enrollment closes in just a few days.
In the meantime, please enjoy this month's article, which answers a question I've been asked a lot recently.
Happy analyzing!
Karen
Feature Article: The Difference Between Logistic and Probit Regression
One question that seems to come up pretty often is:
What is the difference between logistic and probit regression?
Let's start with how they're the same:
Both are types of generalized linear models. This means they have this form:

Both can be used for modeling the relationship between one or more
numerical or categorical predictor variables and a categorical outcome.
Both have versions for binary, ordinal, or multinomial categorical
outcomes. Each of these requires specific coding of the
outcome. For example, in both logistic and probit models, a
binary outcome must be coded as 0 or 1.
So logistic and probit models can be used in the exact same situations. How do they differ?
The real difference is theoretical: they use different link functions.
In generalized linear models, instead of using Y as the outcome, we use
a function of the mean of Y. This is the link function. (For
categorical variables, the mean is P, the probability of a specific
response category).
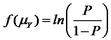
A logistic regression uses a logit link function:
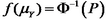
and a probit regression uses an inverse normal link function:
These are not the only two link functions that can be used for categorical data, but they're the most common.
The difference in the overall results of the model are usually slight
to non-existent, so on a practical level it doesn't usually matter
which one you use.
So the choice usually comes down to communication and interpretation.
Communication:
In some fields, the convention is to use a probit model. Even if
you get the same results from a logistic model, it's worth sticking to
the one your audience is familiar with if you're in one of those
fields. Why confuse your audience when the results are the same?
Interpretation:
Anyone who has ever struggled to interpret an odds
ratio may find it difficult to believe that a logistic link leads to
more intuitive coefficients. But because we can back transform
those log-odds into odds ratios, we can get a somewhat intuitive way to
interpret effects.
With a probit link, it's not so easy. After all, what does that inverse normal really mean?
Remember back to intro stats when you had to look up in Z tables the
area under the normal curve for a specific Z value? That area
represents a cumulative probability: the probability that Z is less
than or equal to the specified Z value.
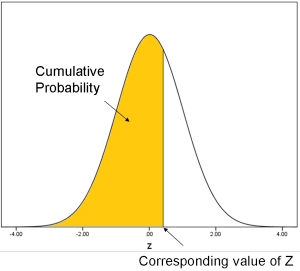
When we do the inverse normal transformation, we're
going in the opposite direction: for any cumulative probability, what
is the corresponding Z value?
So you can think of the probit function as the Z (standard normal) value that corresponds to a specific cumulative probability.
Coefficients for probit models can be interpreted as the difference in
Z values associated with each one-unit difference in the predictor
variable.
Not very intuitive.
A more useful way to interpret these coefficients is to use the model
to calculate predicted probabilities at different values of X.
Remember, though, just like in logistic regression, the difference in
the probability isn't equal for each one-unit change in the
predictor. The sigmoidal relationship between a predictor and
probability is nearly identical in probit and logistic
regression. A one unit difference in X will have a bigger impact
on probability in the middle than near 0 or 1.
That said, if you do enough of these, you can certainly get used the
idea and will start to have a better idea of the size of each Z-score
difference.
References and Further Reading:
Probit Regression Models
Five Extensions of the General Linear Model
|