Should you drop outliers? Outliers are one of those statistical issues that everyone knows about, but most people aren’t sure how to deal with. Most parametric statistics, like means, standard deviations, and correlations, and every statistic based on these, are highly sensitive to outliers.
And since the assumptions of common statistical procedures, like linear regression and ANOVA, are also based on these statistics, outliers can really mess up your analysis.
Despite all this, as much as you’d like to, it is NOT acceptable to
drop an observation just because it is an outlier. They can be legitimate observations and are sometimes the most interesting ones. It’s important to investigate the nature of the outlier before deciding. Here are some things to consider:
- If it is obvious that the outlier is due to incorrectly entered or measured data, you should drop the outlier:
For example, I once analyzed a data set in which a woman’s weight was recorded as 19 lbs. I knew that was physically impossible. Her true weight was probably 91, 119, or 190 lbs, but since I didn’t know which one, I dropped the outlier.
This also applies to a situation in which you know the datum did not accurately measure what you intended. For example, if you are testing people’s reaction times to an event, but you saw that the participant is not paying attention and randomly hitting the response key, you know it is not an accurate measurement.
- If the outlier does not change the results but does affect assumptions, you may drop the outlier. But note that in a footnote of your paper.
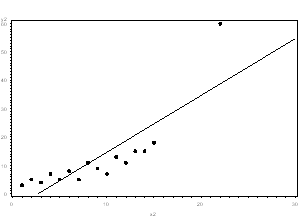
Neither the presence nor absence of the outlier in the graph below would change the regression line:

- More commonly, the outlier affects both results and assumptions. In this situation, it is not legitimate to simply drop the outlier. You may run the analysis both with and without it, but you should state in at least a footnote the dropping of any such data points and how the results changed.

- If the outlier creates a strong association, you should drop the outlier and should not report any association from your analysis.
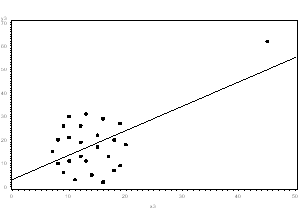
In the following graph, the relationship between X and Y is clearly created by the outlier. Without it, there is no relationship between X and Y, so the regression coefficient does not truly describe the effect of X on Y.

So in those cases where you shouldn’t drop the outlier, what do you do?
One option is to try a transformation. Square root and log transformations both pull in high numbers. This can make assumptions work better if the outlier is a dependent variable and can reduce the impact of a single point if the outlier is an independent variable.
Another option is to try a different model. This should be done with caution, but it may be that a non-linear model fits better. For example, in example 3, perhaps an exponential curve fits the data with the outlier intact.
Whichever approach you take, you need to know your data and your research area well. Try different approaches, and see which make theoretical sense.


Hi Karen,
Thank you for the emails. You got me through statistics during my doctoral program. That’s a great feat for you to accomplish considering my dyscalculia.
Kudos!
Thank you for this explanation, it is really helpful. Is there an academic article or book that I can refer to when using these guidelines in my thesis?
Respected Karen! Can you please add or send me the reference of this justification. As I’m facing this issue in my research but I’ve no reference to mention at the end of Reference list. Advance thanks.
In plot number 2, I do not understand why you want to drop the outlier??
To my point of view, it tells you that the model is rather robust. Remind that a statistical model should only been apply for prediction within the data range used for its calibration. The larger the data range, the more robust it will be for predicting in new situations
yes, i’m having exactly the same question. Eventhough presence and absence of this outlier (in 2nd plot) does not affect the regression line, including it’ll make the model more robust and we can have better predictions
Hi Aman and Vivien,
Sure. It’s a good point. I’m not advocating dropping it. It’s just that dropping it doesn’t have the bad effects that dropping other outliers would. It’s more neutral. As a general rule, leave outliers in unless you’re sure they’re bad data points.
How can a single data point(marked as an outlier) make a model robust by the inclusion of it? Here also, one needs to understand the context of its occurrence and thereby keep or remove it accordingly.
Simply persisting with the outlier data point, just because it falls on the line of regression, isn’t reason enough. It can well be a data point which “looks” correct out of a wrong representation of the actual one.
Absolutely agree about understanding context and deciding whether to remove *any* data point that is not really representing what you’re trying to measure.
When cleaning a large dataset for outliers, does a separate outlier analysis have to be run for every single regression analysis one plans on running? For instance, does running 30 different regressions typically require 30 separate outlier analyses? If so, do the outliers need to be added back into the data set before running the next outlier analysis? If multiple outlier analyses are not required in this case, is just one outlier analysis enough (i.e., entering all of the IVs that I plan to use into one step and regressing only one DV on them simultaneously)?
After checking all of the above, I do not understand the rationale for keeping an outlier that affects both assumptions and conclusion just by principle. This seems counterintuitive since most models will never fit the data perfectly and the point is usually investigates overall trends in the sample population, defending the assumptions parametric models and their inability to take into account outliers that are given undue influence only due to the estimation of the model, not because it really defines the Group/variable. In a survival analysis, maybe somebody died of a car accident (but you dont have the death certificate). Biomarkers cant predict that, neither can most genes. It is not really the outlier there is anything wrong with, but the inability of most parametric tests to deal with 1 or 2 extreme observations. If robust estimators are not available, downweighting or dropping a case that changes the entire conclusion of the model seems perfectly fair (and reporting it).
There are a Lot of nonparametric analyses out there. That’s what I do when I have outlier(s), especially when I have a small sample size (which is often in preclinical research). Nonparametric analyses don’t assume your data follows any distribution! In many of them, you replace the data points with their ‘ranks’, the key is knowing how you should rank your data (it depends on the study design). Then you basically analyze the rank instead. I guess it’s kind of like a transformation, but with the advantage that the analysis is still appropriate for the study design, since you how you rank the data depends on ther study design.
Marla, that’s a good option for some tests, for sure. Not all models though, work with ranks.
In example two, the outlier should have little effect on the slope estimate but it ought to have a BIG effect on the standard error of the slope estimate. It would definitely be worth investigating how it came about. A lot might depend on the physical situation involved, whether we are dealing with correlation or with truly independent and dependent variables, etc.
Very helpful blog! Thank you. By the way, how do I put this page as a reference to my paper?
Hi,is there any specific method to identify outliers and reduce their impact in ANOVA on Nested design because I have Nested design on Gage R&R which contains 4 outliers in 3 operators . Thanks
Use Spearman correlation insted Pearson. It can handle the outliers.
Can we remove outliers based on CV.
To lower down CV, change the replication data value but without any change the mean value of treatment
My rule of thumb is to always drop the outlier. That’s just me though.
Sir,
We drop the outlier, but how we can have value in that place to run ANOVA
I tried this in some study and the effects are not trivial. First, my data had some observations which clearly were quite far from the mean (sd of over 50000). I included them and my parameters were significant all through. Upon removing outliers, one of them was not significant and Adj R^2 fell by over 20%. While in my case of over 10000 observations it may be theoretically right to omit them, I don’t know what the same may have on narrow samples or specific studies. I am analysing household consumption expenditure and conclusions based on outliers will most probably be unrepresentative. I tried the robust errors suggested here as well. I think with outliers(their effect is inflating the variances and hence parameter significance) robust errors should be enough, as much as we trust the underlying framework.
I’m confused by number 4. What happens if you take out the outlier, and things become more significant?
What would you do in this situation?
I have multivariable logistic regression results: With outlier in model p-values are as follows (age:0.044, ethnicity:0.054, knowledge composite variable: 0.059. When I take out the outlier, values become (age:0.424, eth: 0.039, knowledge: 0.074)
So by taking out the outlier, 2 variables become less significant while one becomes more significant.
Should outliers or extremes be removed before developing a norm group for a certain test?
I FEEL OUTLIERS IF NOT INTENTIONAL ARE OFTEN USEFUL DATA WITH VITAL INFORMATIONS THAT NEEDS SPECIAL ATTENTION.SO THE DON’T NEED TO BE DELECTED FROM THE ANALYSIS.
I used a square root to transform the IV weight. This variable is now “more normal” but still significant for non normal. If I use this variable the R2 of my model decreases. How to deal with this? Should I ir should I not use the transformated version of this variable.
Hi John, here’s the good news: IVs don’t have to be normally distributed. You may want to transform a skewed IV if the values in the long tail are exerting too much influence or to make the relationship with Y linear. But there are no model assumptions about the shape of the IV’s distribution.
Thanks for the article
Technically, It’s not justifiable to drop an observation just because it’s an outlier! unless you are sure it’s an error, maybe committed during data entry or at any other stage. For regression analysis, I would advise to use robust regression which deals with this problem.
Hi Oliver,
Agreed. Never drop just because it’s an outlier.
And thanks for the suggestion–I agree robust regression often helps.
Karen
What is robust regression ?
I think robust statistics are the way to go. When you are deciding on whether to delete an outlier, it’s like deciding if its weight should be 0 or 1. But if it’s not due to an error, then you just want to assign it a lower weight between 0 and 1 so it does not have an undue influence. After all, it is just one point and it shouldn’t influence the results more than any other point.